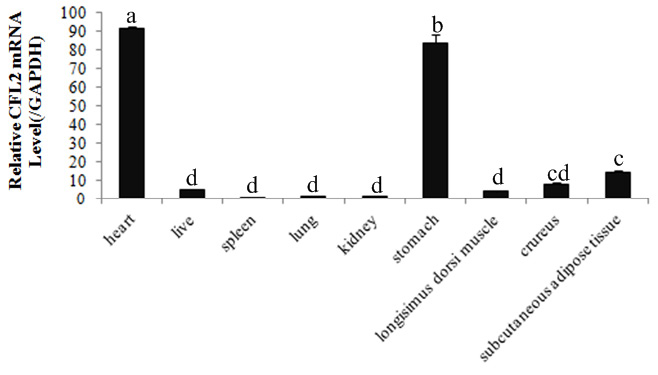
Fig. 3.
Expression pattern analysis of CFL2 mRNA in DBS cattle by real-time PCR method. The value of CLF2 in spleen was arbitrarily set to 1.0. The different letters (a, b, c and d) indicate a p-value of less than 0.05 in a Student’s t-test.