Figure 2:
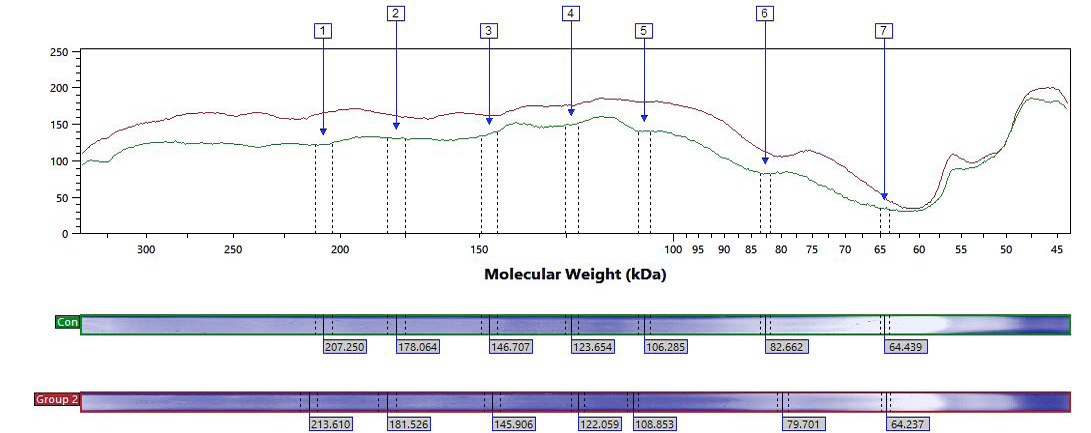
Electropherogram representing evaluation of control and group 2, given the volume of protein expression on Y-axis and molecular weight on X-axis.
Electropherogram representing evaluation of control and group 2, given the volume of protein expression on Y-axis and molecular weight on X-axis.