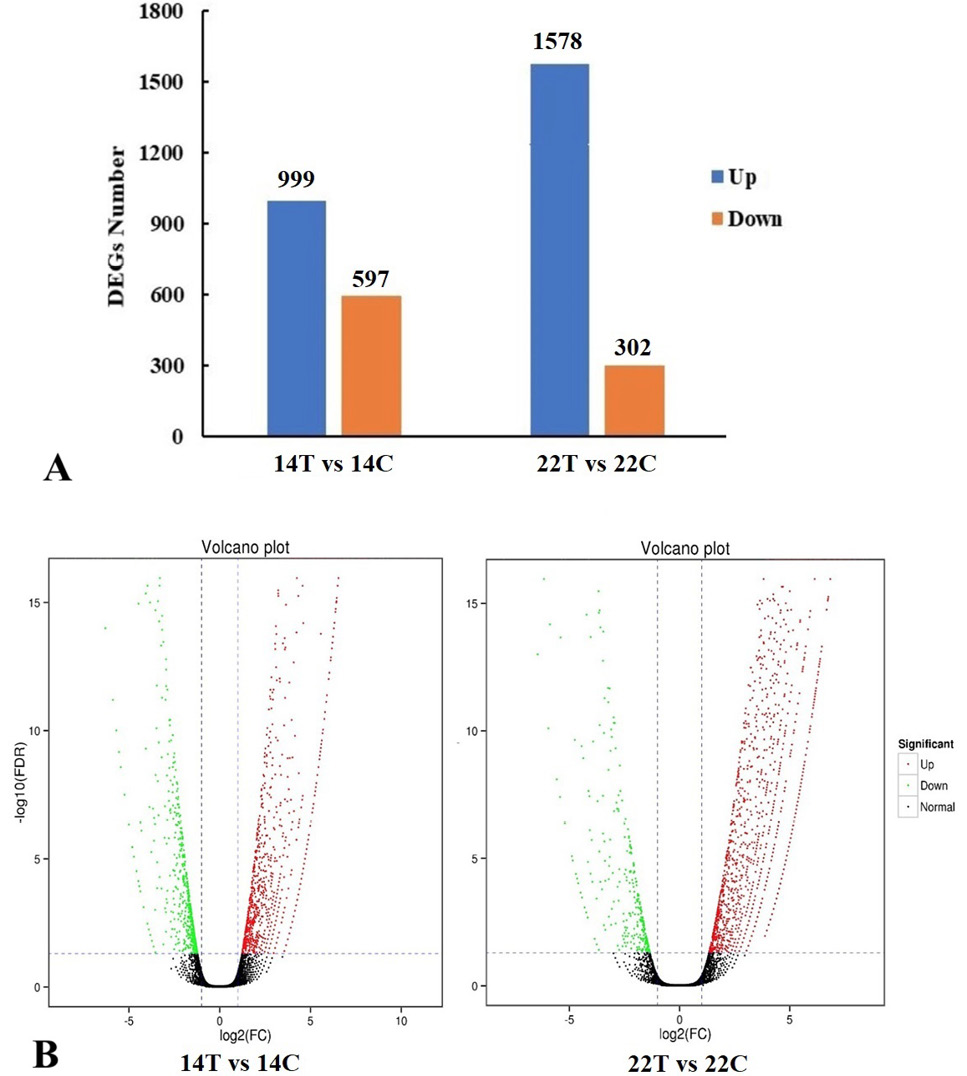
Fig. 1.
(A) Numbers of up-regulated and down-regulated DEGs between different cDNA libraries. Blue color represents up-regulated expression of DEGs; Brown color represents down-regulated expression of DEGs. (B) Volcano plot between different cDNA libraries. The log 2 fold represents the mean expression level. Red dots represent up-regulated genes, black dots represent no significant DEGs, the green dots represent down-regulated genes. 14T/14C, the DEGs were generated from the treatment group relative to the control group at 14 dpi; 22T/22C, the DEGs of treatment group relative to the control group at 22 dpi.