
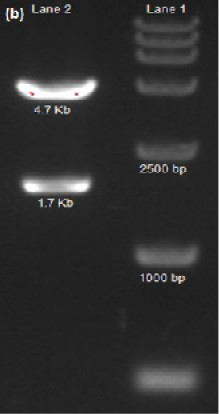
Figure 1b
Agarose gel electrophoresis showing the pattern of the digestion analysis. Lane 1 is the molecular weight marker and Lane 2 is the double digested pCA-Egy-H5 plasmid DNA showing 2 bands, the upper band is the pCAGGS plasmid at 4.7 Kb and the Lower band is the opti HA at 1.7 Kb.