
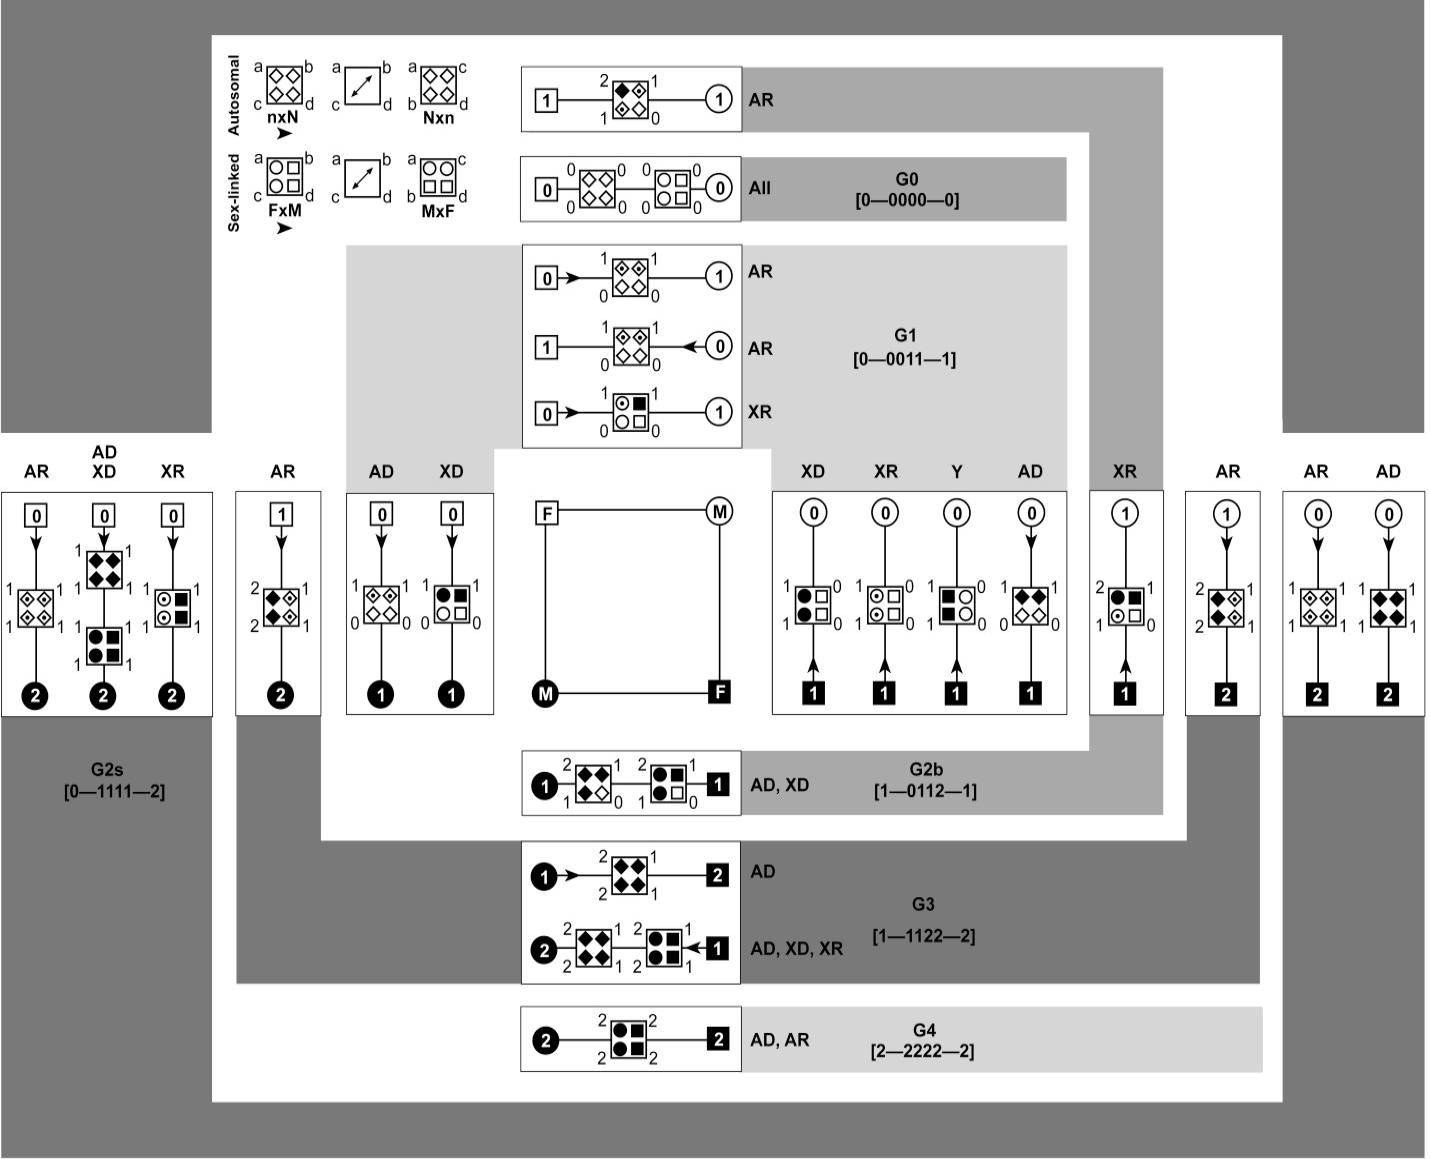
Phenotype-to-genotype square (P2G-Sq) describing four possible parent unions on the basis of phenotype (square in the center) and their possible genotype and phenotype probabilities in parents and their offspring accordingly (along each side of this square). For any Mendelian trait, the genotype and phenotype probabilities will lie on any of the four sides of this central square. Genotypic and phenotypic outcomes in offspring are represented by modified Punnett square in the middle of marriage line between parents. Marriage lines where two modified Punnett squares are present represent the outcomes for both possible autosomal and sex-linked inheritance. Further, all outcomes are explained with respect to genotype probability groups. All parent unions and offspring outcomes connected with a similar shaded region belong to one genotype group mentioned in that shade. (n, parent with smaller genotype code; N, parent with larger genotype code; n=N when both parents have same genotype code; F, father; M, mother; x, cross; Arrowhead, describe which parent to consider first when writing a cross e.g., 0→1 means 0 x 1; AR, autosomal recessive; AD, autosomal dominant; XR, X-linked recessive; XD, X-linked dominant; Y, Y-linked; All, possible in all patterns of inheritance; Unfilled symbols, normal; Filled symbols, affected; Dot in a symbol, carrier).