
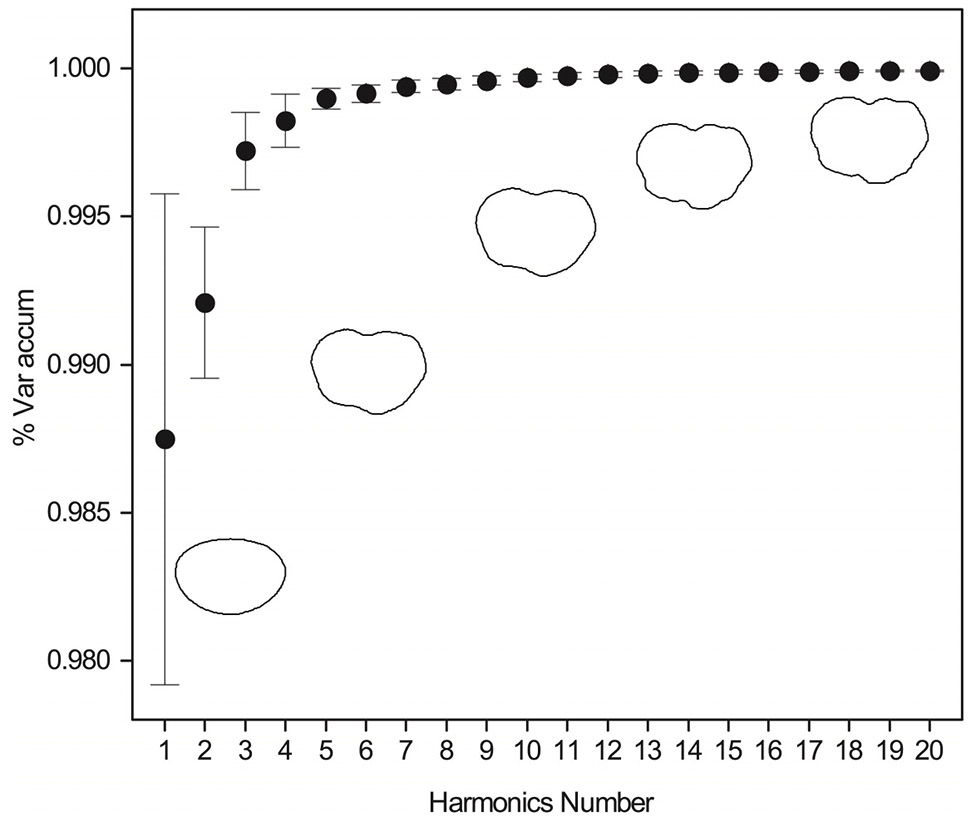
Fig. 2.
Periodogram of 20 harmonics for 30 randomly selected otolith of G. selincuoensis. Mean (solid dots) and standard deviation (whiskers) represent the accumulated percentage of variance (% Var accum). Otolith contours shapes defined by 2,6,10,14 and 18 harmonics were plotted.