View larger version:
Download Original File
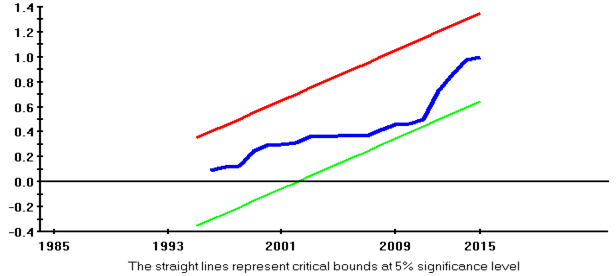
Figure 2:
Cumulative sum of square of recursive residuals
Red lines shows the upper control limit, green shows lower control limit and blue shows average drawn from original data.
