
Fig. 1.
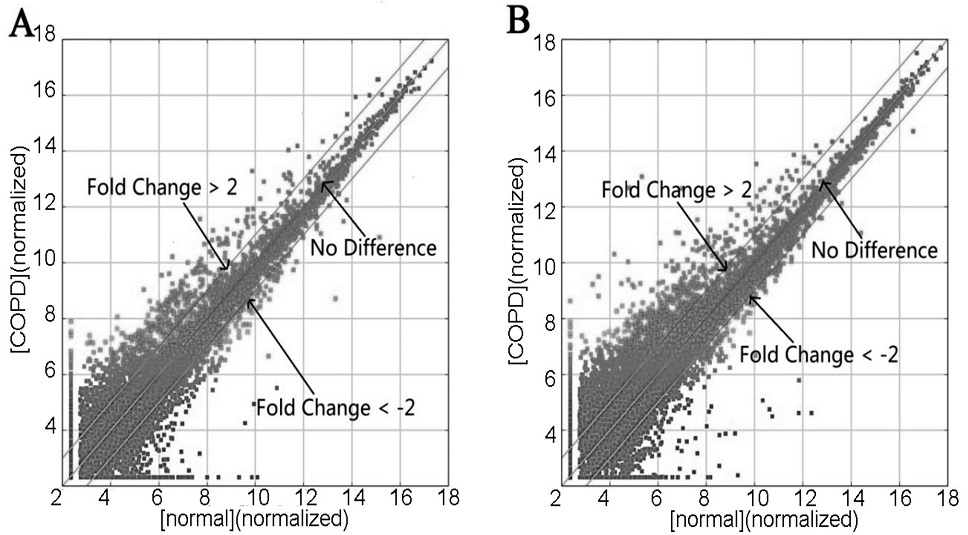
Scatter plot of COPD and control group. (A) Scatter Plot shows lncRNAs are differentially expressed between COPD and control group; (B) Scatter Plot shows mRNAs are differentially expressed between COPD and control group.
Scatter plot of COPD and control group. (A) Scatter Plot shows lncRNAs are differentially expressed between COPD and control group; (B) Scatter Plot shows mRNAs are differentially expressed between COPD and control group.