
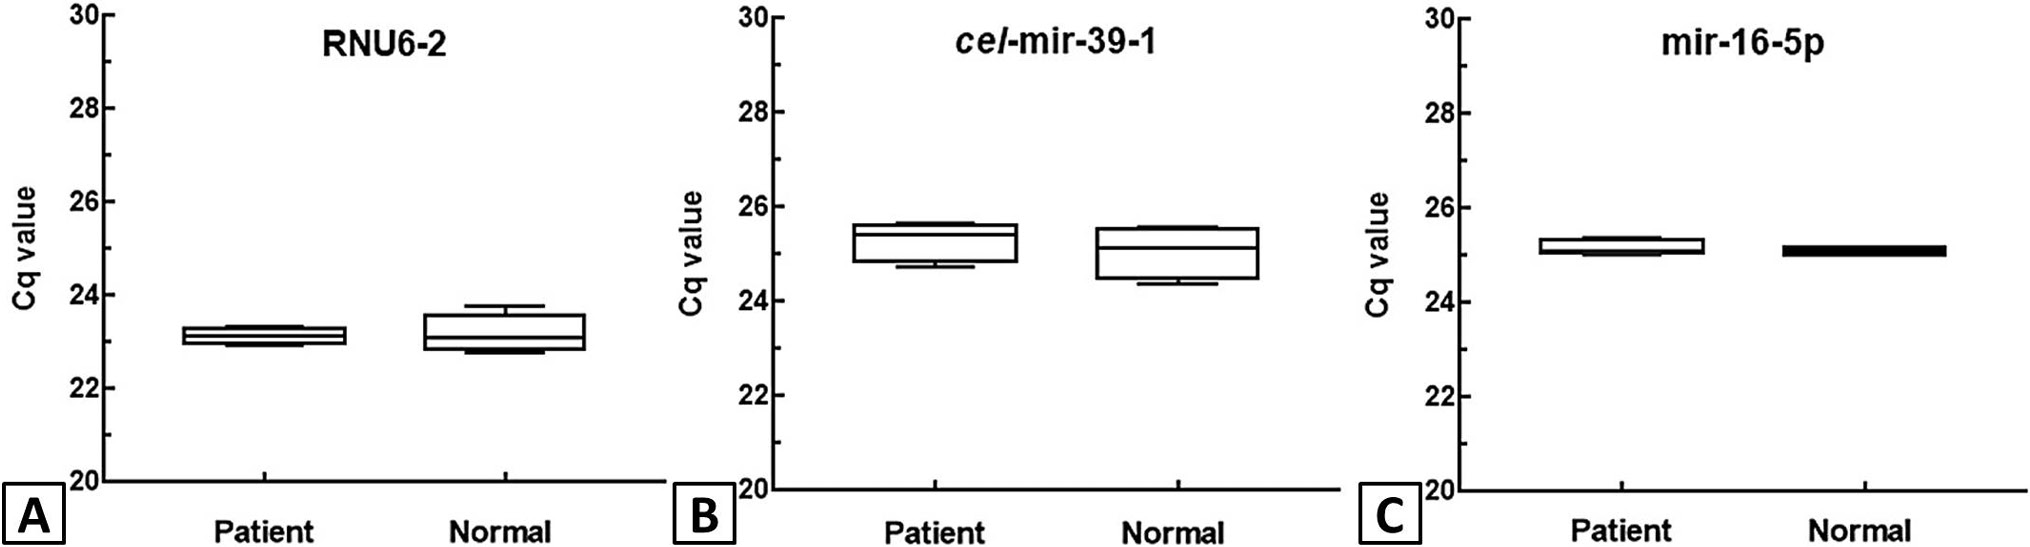
Fig. 2.
Determination of quantification cycle (Cq value) of the three candidate reference genes RNU6-2 (A) cel-mir-39-1 (B) and mir-16-5p (C) in the patient and normal control samples of ALL determined through qPCR. The values for each distribution are given as mean ± standard deviation as shown in box and whiskers plot.