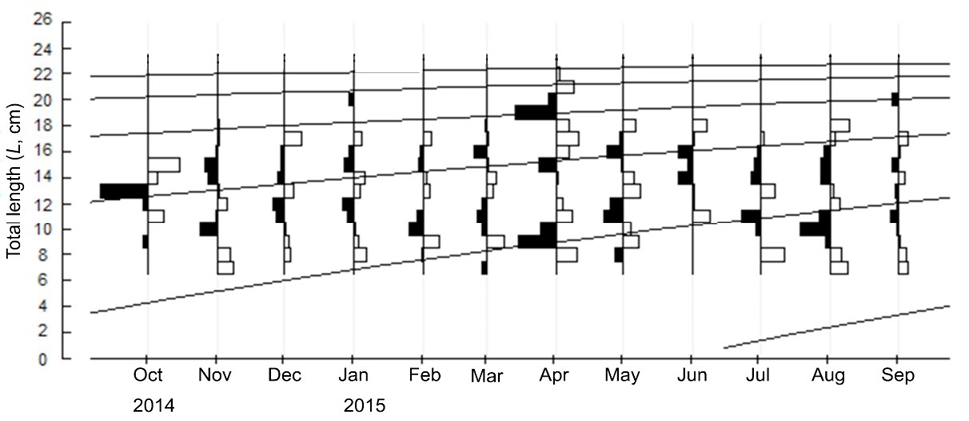
Length-frequency distribution of T. vagina (n = 1,527). The curves show the increase of fish length over time.