View larger version:
Download Original File
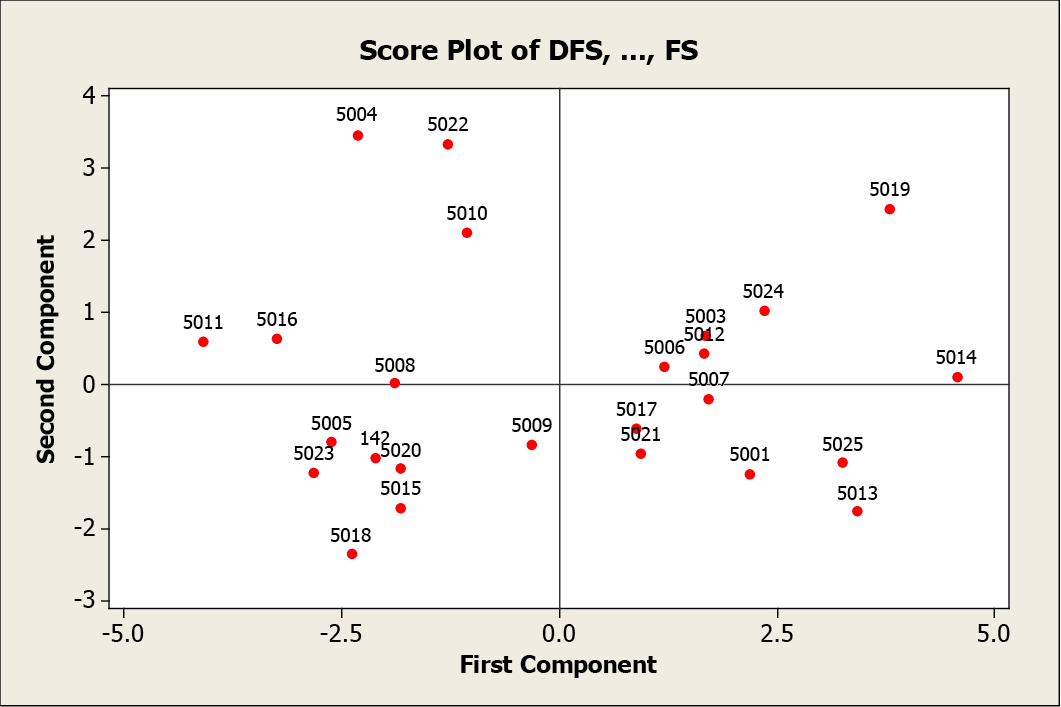
Figure 3:
A score plot showing genotypes possessing variability contributing traits.
