
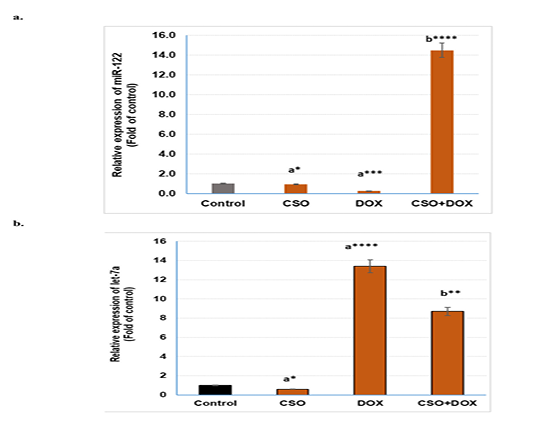
Figure 10
qRT-PCR analysis of the relative expression of miR-122 (a) and let-7a (b). in liver tissues of different groups. Data are expressed as mean ± SE. *p < 0.05, **p < 0.01, *** p< 0.001, and **** p< 0.0001, a compared to the corresponding control, b compared to DOX-treated group