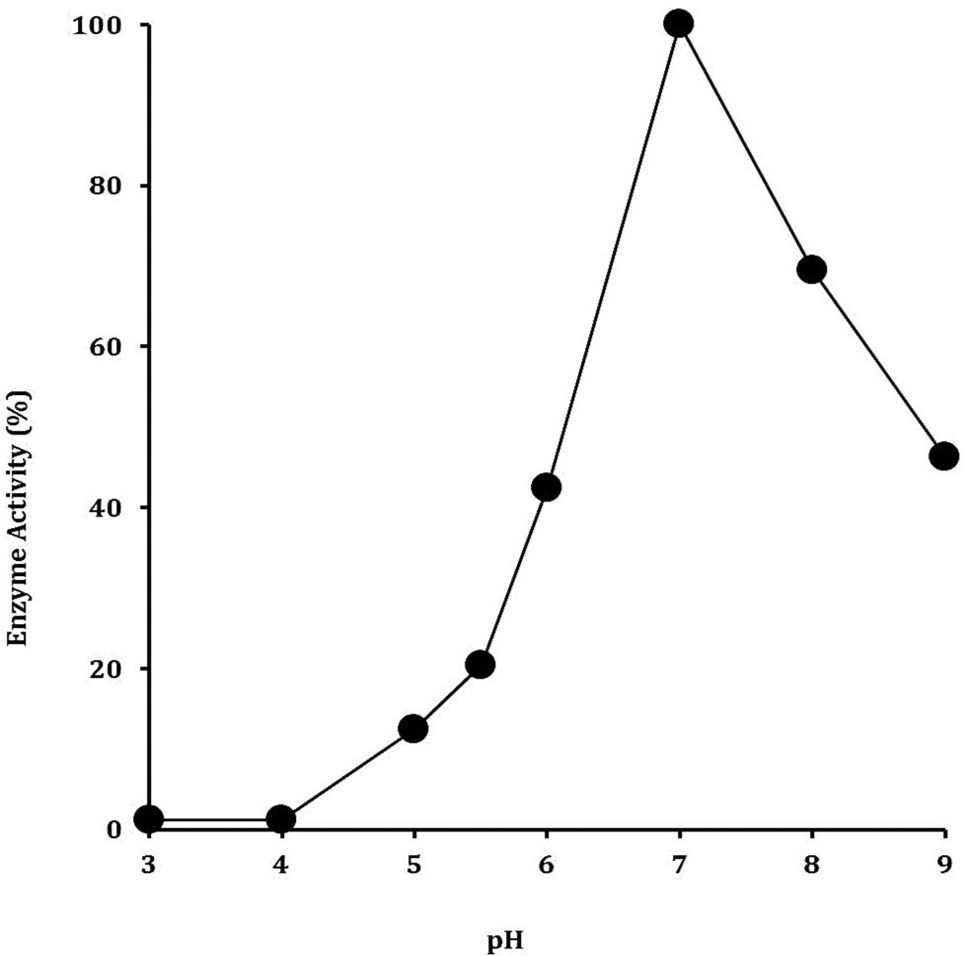
Fig. 4.
Optimization of pH for the maximal production of recombinant cellulase. The cellulase production was analyzed in 50 mM of each of sodium acetate buffer (3-5), sodium phosphate buffer (5-7) and Tris HCl buffer (7-9). The data on X-axis indicates the buffer pH values while on Y-axis show relative activity (%).