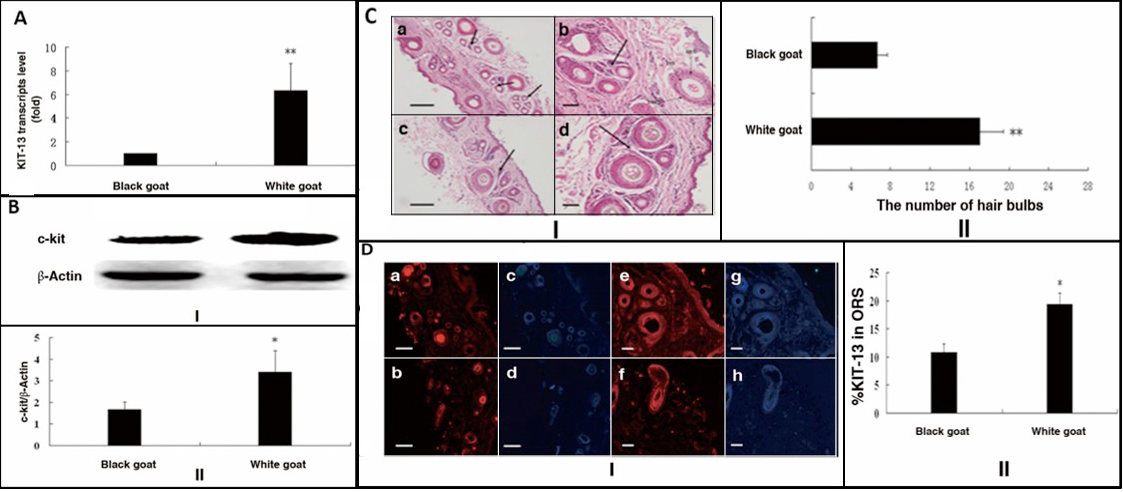
A, Quantifications of KIT-exon13 in white cashmere goats and black cashmere goats; B, Western Blot analysis of c-KIT protein expression in skin samples with different coat color; C, H&E staining analysis of the expression of KIT-13 in skin samples about fair follicle and hair bulb for goats with different coat color. (a and c) the white goats and the black goats KIT-exon 13 expression (100×). (b and d) the white goats and the black goats KIT-exon 13 expression (200×). The number of hair bulbs analysis of c-KIT expression in skin samples with different coat color. ORS, outer root sheath; IRS, inner root sheath; HS, hair shaft cells; D, (I) Representative immunohistochemical staining of KIT in fair follicle for cashmere goats with different coat color. (a and b) the white goat and the black goat KIT-exon 13 anbidy expression (100×). (c and d) the white goat and the black goat KIT-exon 13 nucleus expression (100×). (e and f) the white goat and the black goat KIT-exon 13 anbidy expression (200×). (g,h) the white goat and the black goat KIT-exon 13 nucleus expression (200×). (II) The percentage of KIT-13 in different coat color goats’ ORS.