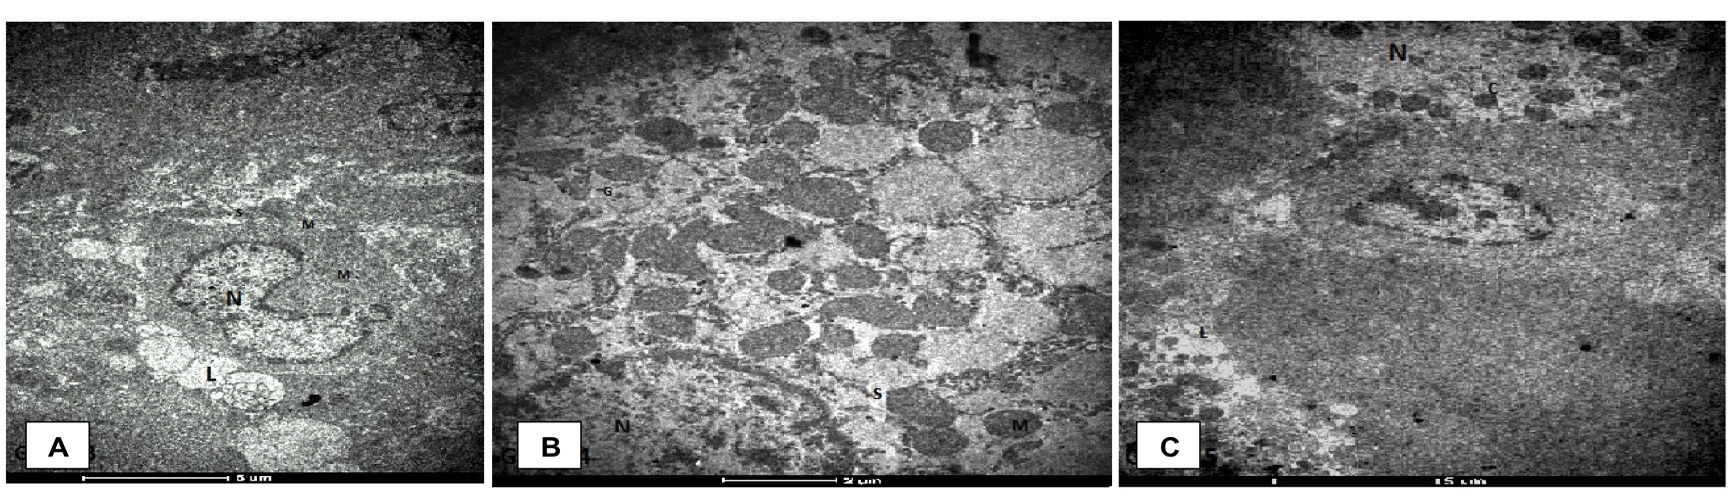
Fig 2
Transmission electron micrographs showing morphological changes in rat liver cells. A, Group 3-GalN treated tissue showing the nucleus (N) compressed by large lipid droplets (L). The cytoplasm shows fewer rER and glycogen rosettes in-between high electron-dense mitochondria (m) and dilated sER (S) (4200x); B, Group 4-Tissues EA administered before GalN treatment with showing less lipid droplets (L), less electrondensity of mitochondria (m), less dilated sER (S) and condensed glycogen rosettes (G) compared to group 3 (8200x); C, Group 5- GalN before EA administered liver tissue with showing fewer lipid droplets (L) and ring shaped chromatin condensation © compared to D-galactosamine group (4200x).