
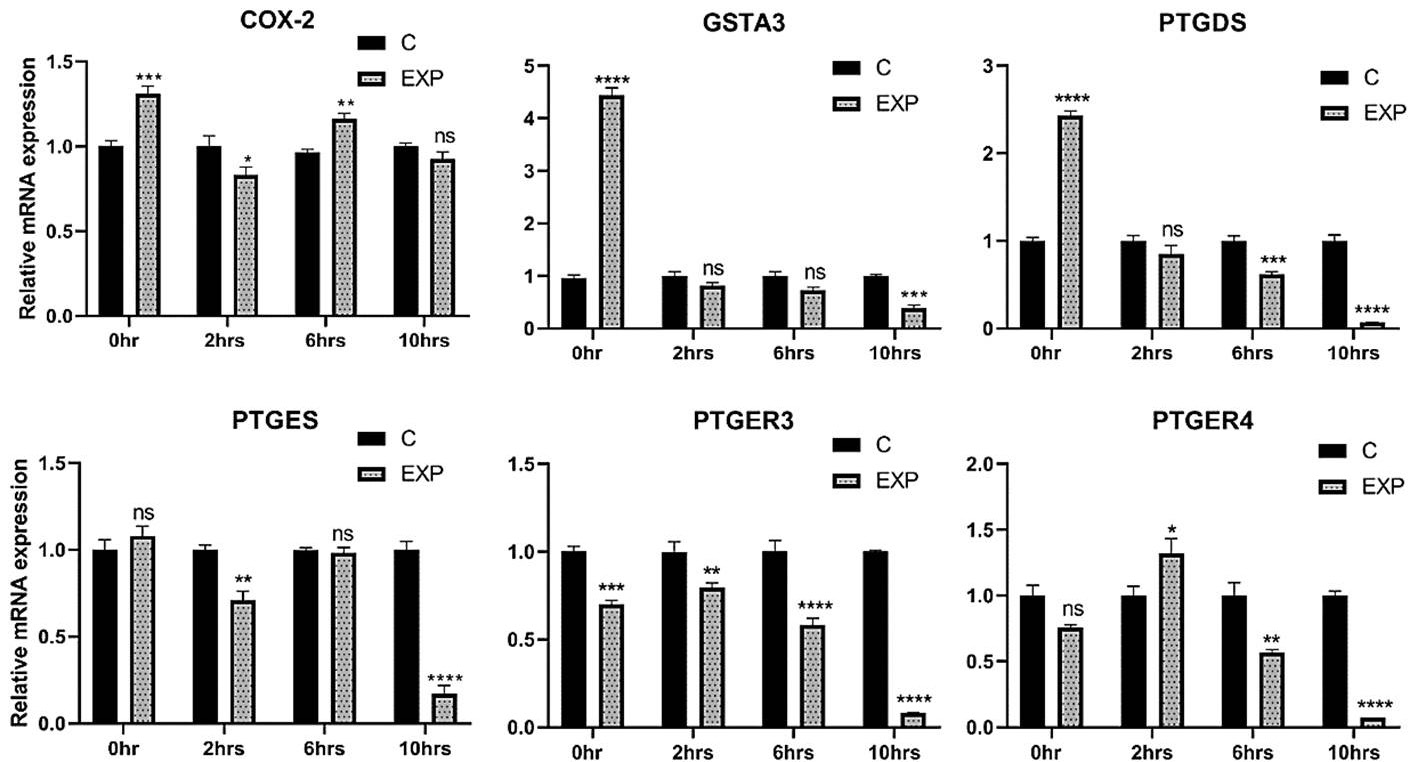
Fig. 1.
mRNA expression of PG-related genes in the erythrocytes of chickens at time intervals of 0, 2, 6 and 10 h. Asterisks (*) indicating significant differences among experimental and control groups (*P < 0.05; **p < 0.01; ***P < 0.0004; ****P < 0.0001; ns, not significant); C, control; Exp, experimental.