
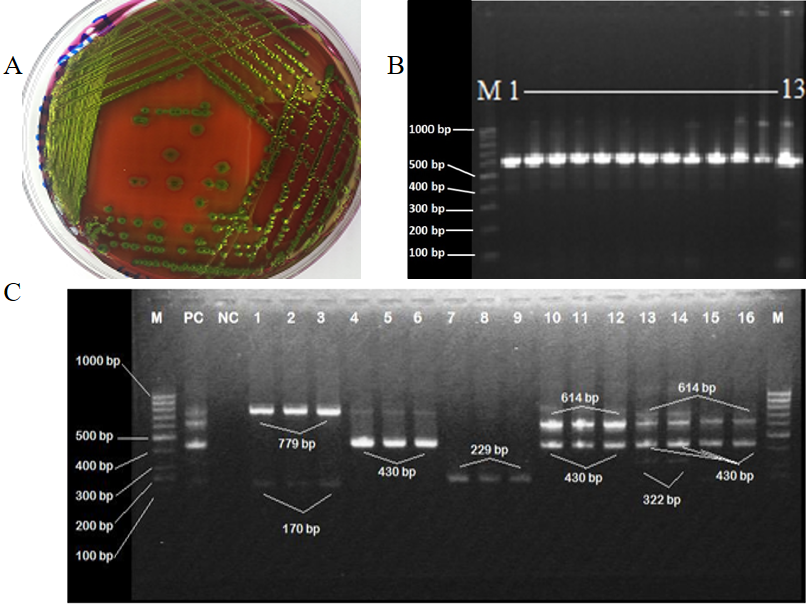
Isolation and identification of various E. coli pathotypes based on virulent gene profile. A, growth of purified E. coli isolate on EMB agar; B, representative results of amplification of uidA gene of E.coli from collected samples: Lanes 1-13 positive amplification of uidA gene (630bp). M is molecular weight marker, size of which is demarcated on the left; C, multiplex PCR results showing amplification fragments of different DEC. Lanes 1-3 positive amplification of stx2 (779bp). 4-6 shows positive amplification of Agg (430bp), 7-9 for eae gene (229bp), 10-12 shows amplification of stx1 (614bp) and Agg (430bp). Lanes 13-14 denotes the amplification of stx1, Agg and elt genes (614bp, 430bp and 322bp respectively). Lanes 15-16 show amplification of stx1 (614bp) and Agg genes (430bp). M, PC and NC denotes molecular weight marker, positive control and negative control, respectively.