Figure 2:
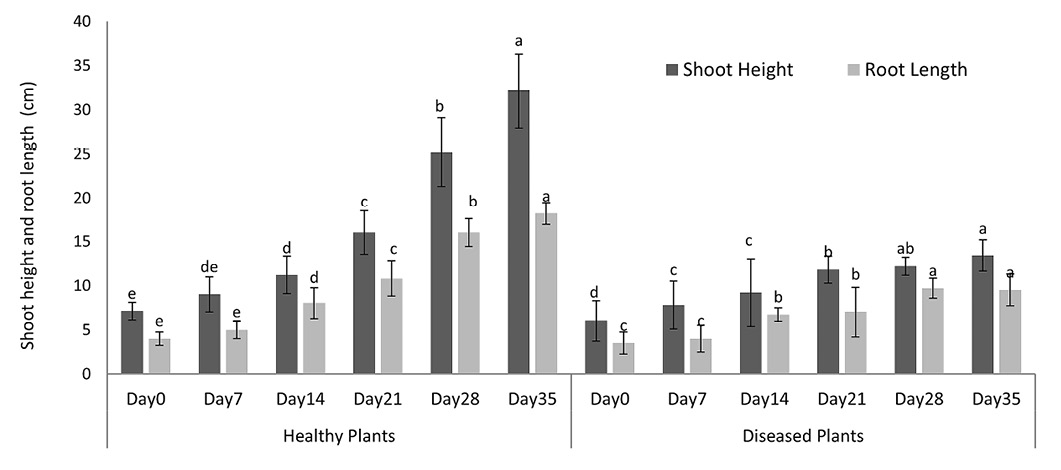
Comparison of shoot height and root length of healthy and diseased plants of tomato. Alphabets indicate statistical difference among treatments (factorial ANOVA; HSD test at α = 0.05)
Comparison of shoot height and root length of healthy and diseased plants of tomato. Alphabets indicate statistical difference among treatments (factorial ANOVA; HSD test at α = 0.05)