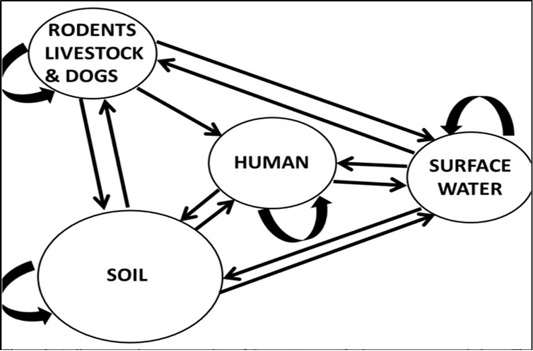
Figure 3
A diagrammatic illustration of Leptospira transfer between meta-population. The circles represent habitats where Leptospira can reside. Arrows represent migration rates between habitats with flow from habitat i to habitat j represented by mij. The large arrows indicate density-dependent exponential growth of bacteria within each habitat. NB: Rodent data will be sourced from the literature