View larger version:
Download Original File
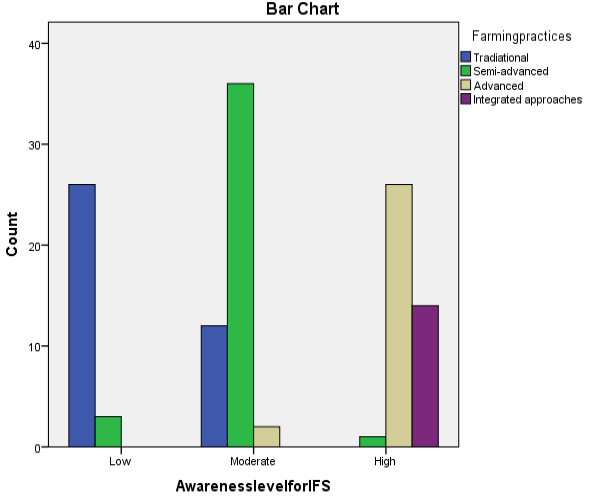
Figure 1:
Bar chart as a graphical representation for awareness level and farming choices of respondents.
