Figure 16:
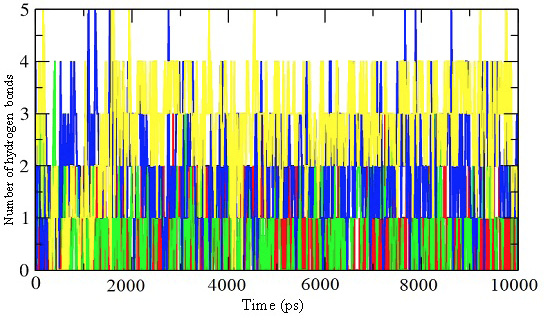
Representation of the number of hydrogen bonds per time frame for the enzyme-inhibitor complex of inhibitor 39 (red), 45 (green), 52 (blue), and 57 (yellow).
Representation of the number of hydrogen bonds per time frame for the enzyme-inhibitor complex of inhibitor 39 (red), 45 (green), 52 (blue), and 57 (yellow).