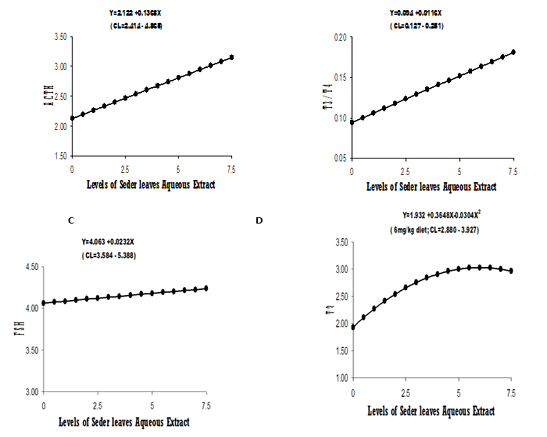
Figure 1
Dose–response curve of ACTH (A) T3/T4 (B), FSH(C), T3 (D) ,for different levels of dietary supplemental, x and y are the dependent (Seder aqueous extract levels) and the independent variables of the regression equation, respectively. The figure only shows significant relationships (p < 0.05).