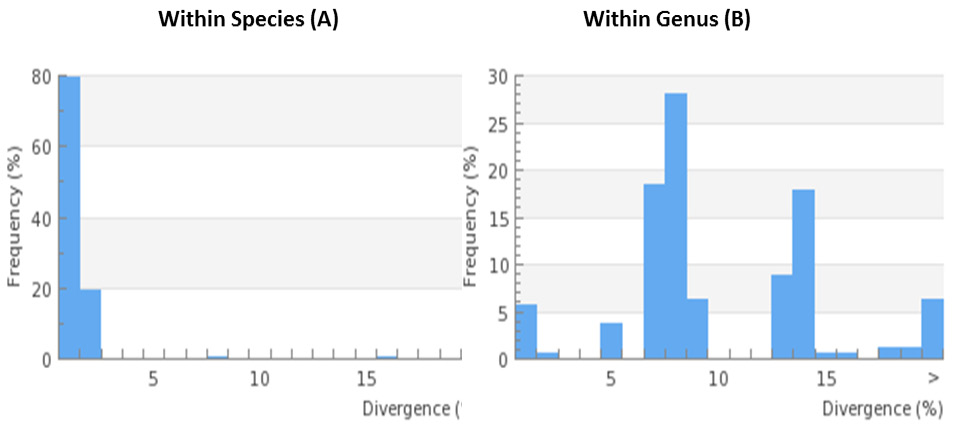
Figure 4:
Both the bargraph with sequence divergences at different species (A) and genus level (B) shows how much the organisms belonging to various taxonomic levels are genetically disimilar from each other. Organisms at genus level containg the more significant barcode distances as compared to the species level.