View larger version:
Download Original File
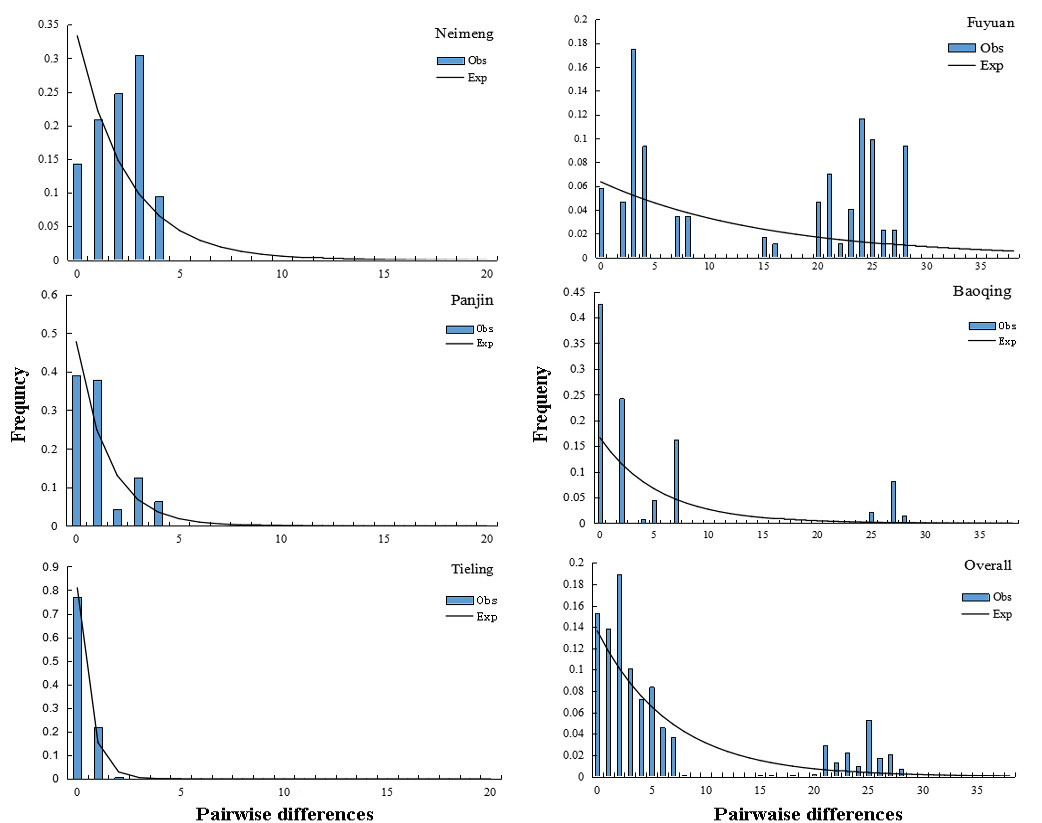
Fig. 3.
Observed (bar) and expected (line) mismatch distribution for P. glenii populations.