
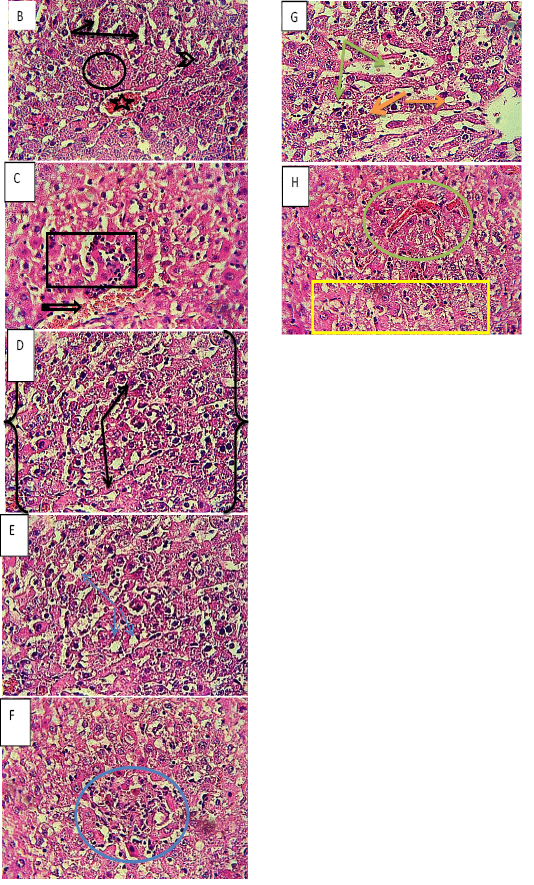
Liver Sections of testes groups, (A) control group showing (bow) normal hepatic parenchyma, exhibiting well defined hepatocytes have polyhedric in shape, (arrows) hepatocytes, (arrows head) hepatocytes nucleus, transversally sectioned sinusoid, and (star) hepatic portal vein . (B, C, and D) 5 mg/kg/day group, showing (star) congestion of central vein, (circle) fat degeneration of hepatocytes, (arrow head) karyopyknosis, (arrows) dilated of sinusoids, (thick arrow) capillaries hemorrhage, and (square) slightly chronic inflammation represented by lymphocytes. (E, F, G, and H) 5, 8, 12, and 16 mg/kg/day group showing, (blue arrows) vacuolization, (green arrows) severe dilated congestion of sinusoids, (blue circle) necrotic foci and aggregation of inflammation cells, and (orange arrows) severe coagulative necrotic vasculitis, (green circle) congestion of sinusoids (a rectangle) many altered cells exhibit nuclear pleomorphisms, (H and E 400X).