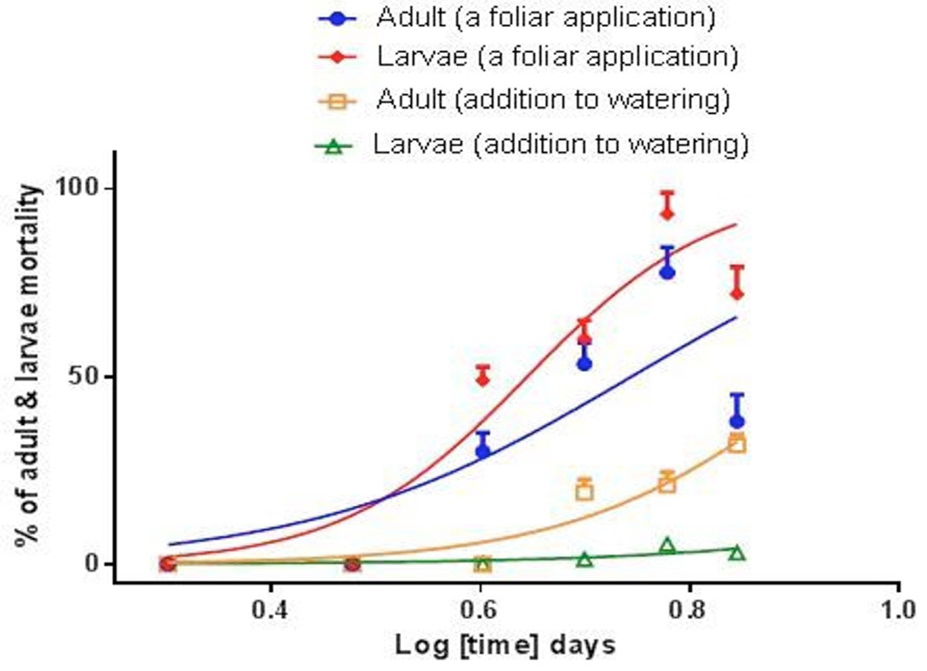
Fig. 4.
Comparison of the effects of oxamyl on the mortality of adult and larvae during 7 days of investigation after a foliar application and adding with irrigation water (under field conditions) expressed as percentage mortality after exposure to well water (Control). Each point is the mean of mortality percentage ± SEM but in most cases the error bars are smaller than the symbols used. The lines were fitted using a non-linear regression in Graph Pad Prism 7 with the maximum plateau being 100% and the minimum being 0%. Each curve indicates the mortality of adult and larvae after exposure to oxamyl by a foliar application and adding with irrigation water (under field conditions) compared with control.