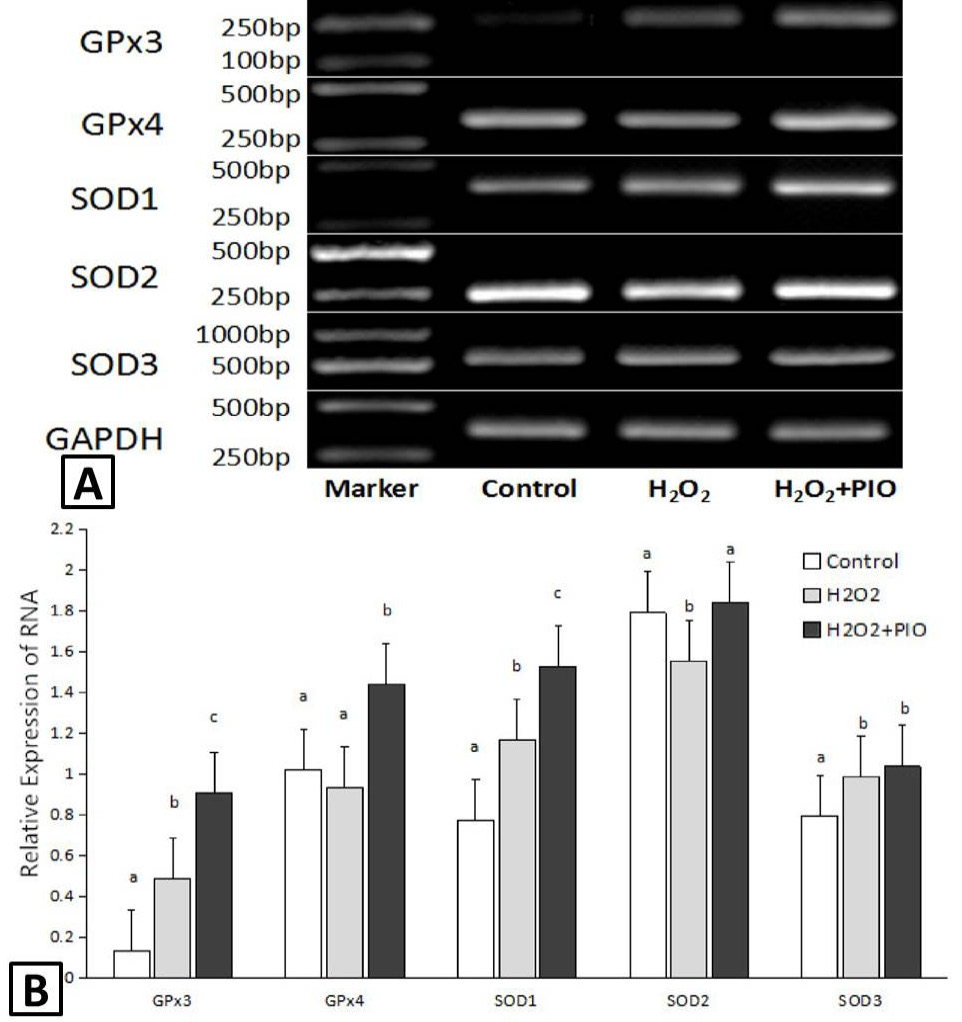
Fig. 3.
The expression of GPX and SOD in cultured mouse embryos, which were exposed to H2O2 of 30 min and then treated with pioglitazone, with untreated embryos as a control. A, PCR results of GPX and SOD RNA in mouse embryos; B, Relative expression of GPX and SOD RNA normalized with the internal marker GAPDH. Different letters in the same picture mean the significant difference between the treatments (P < 0.05).