
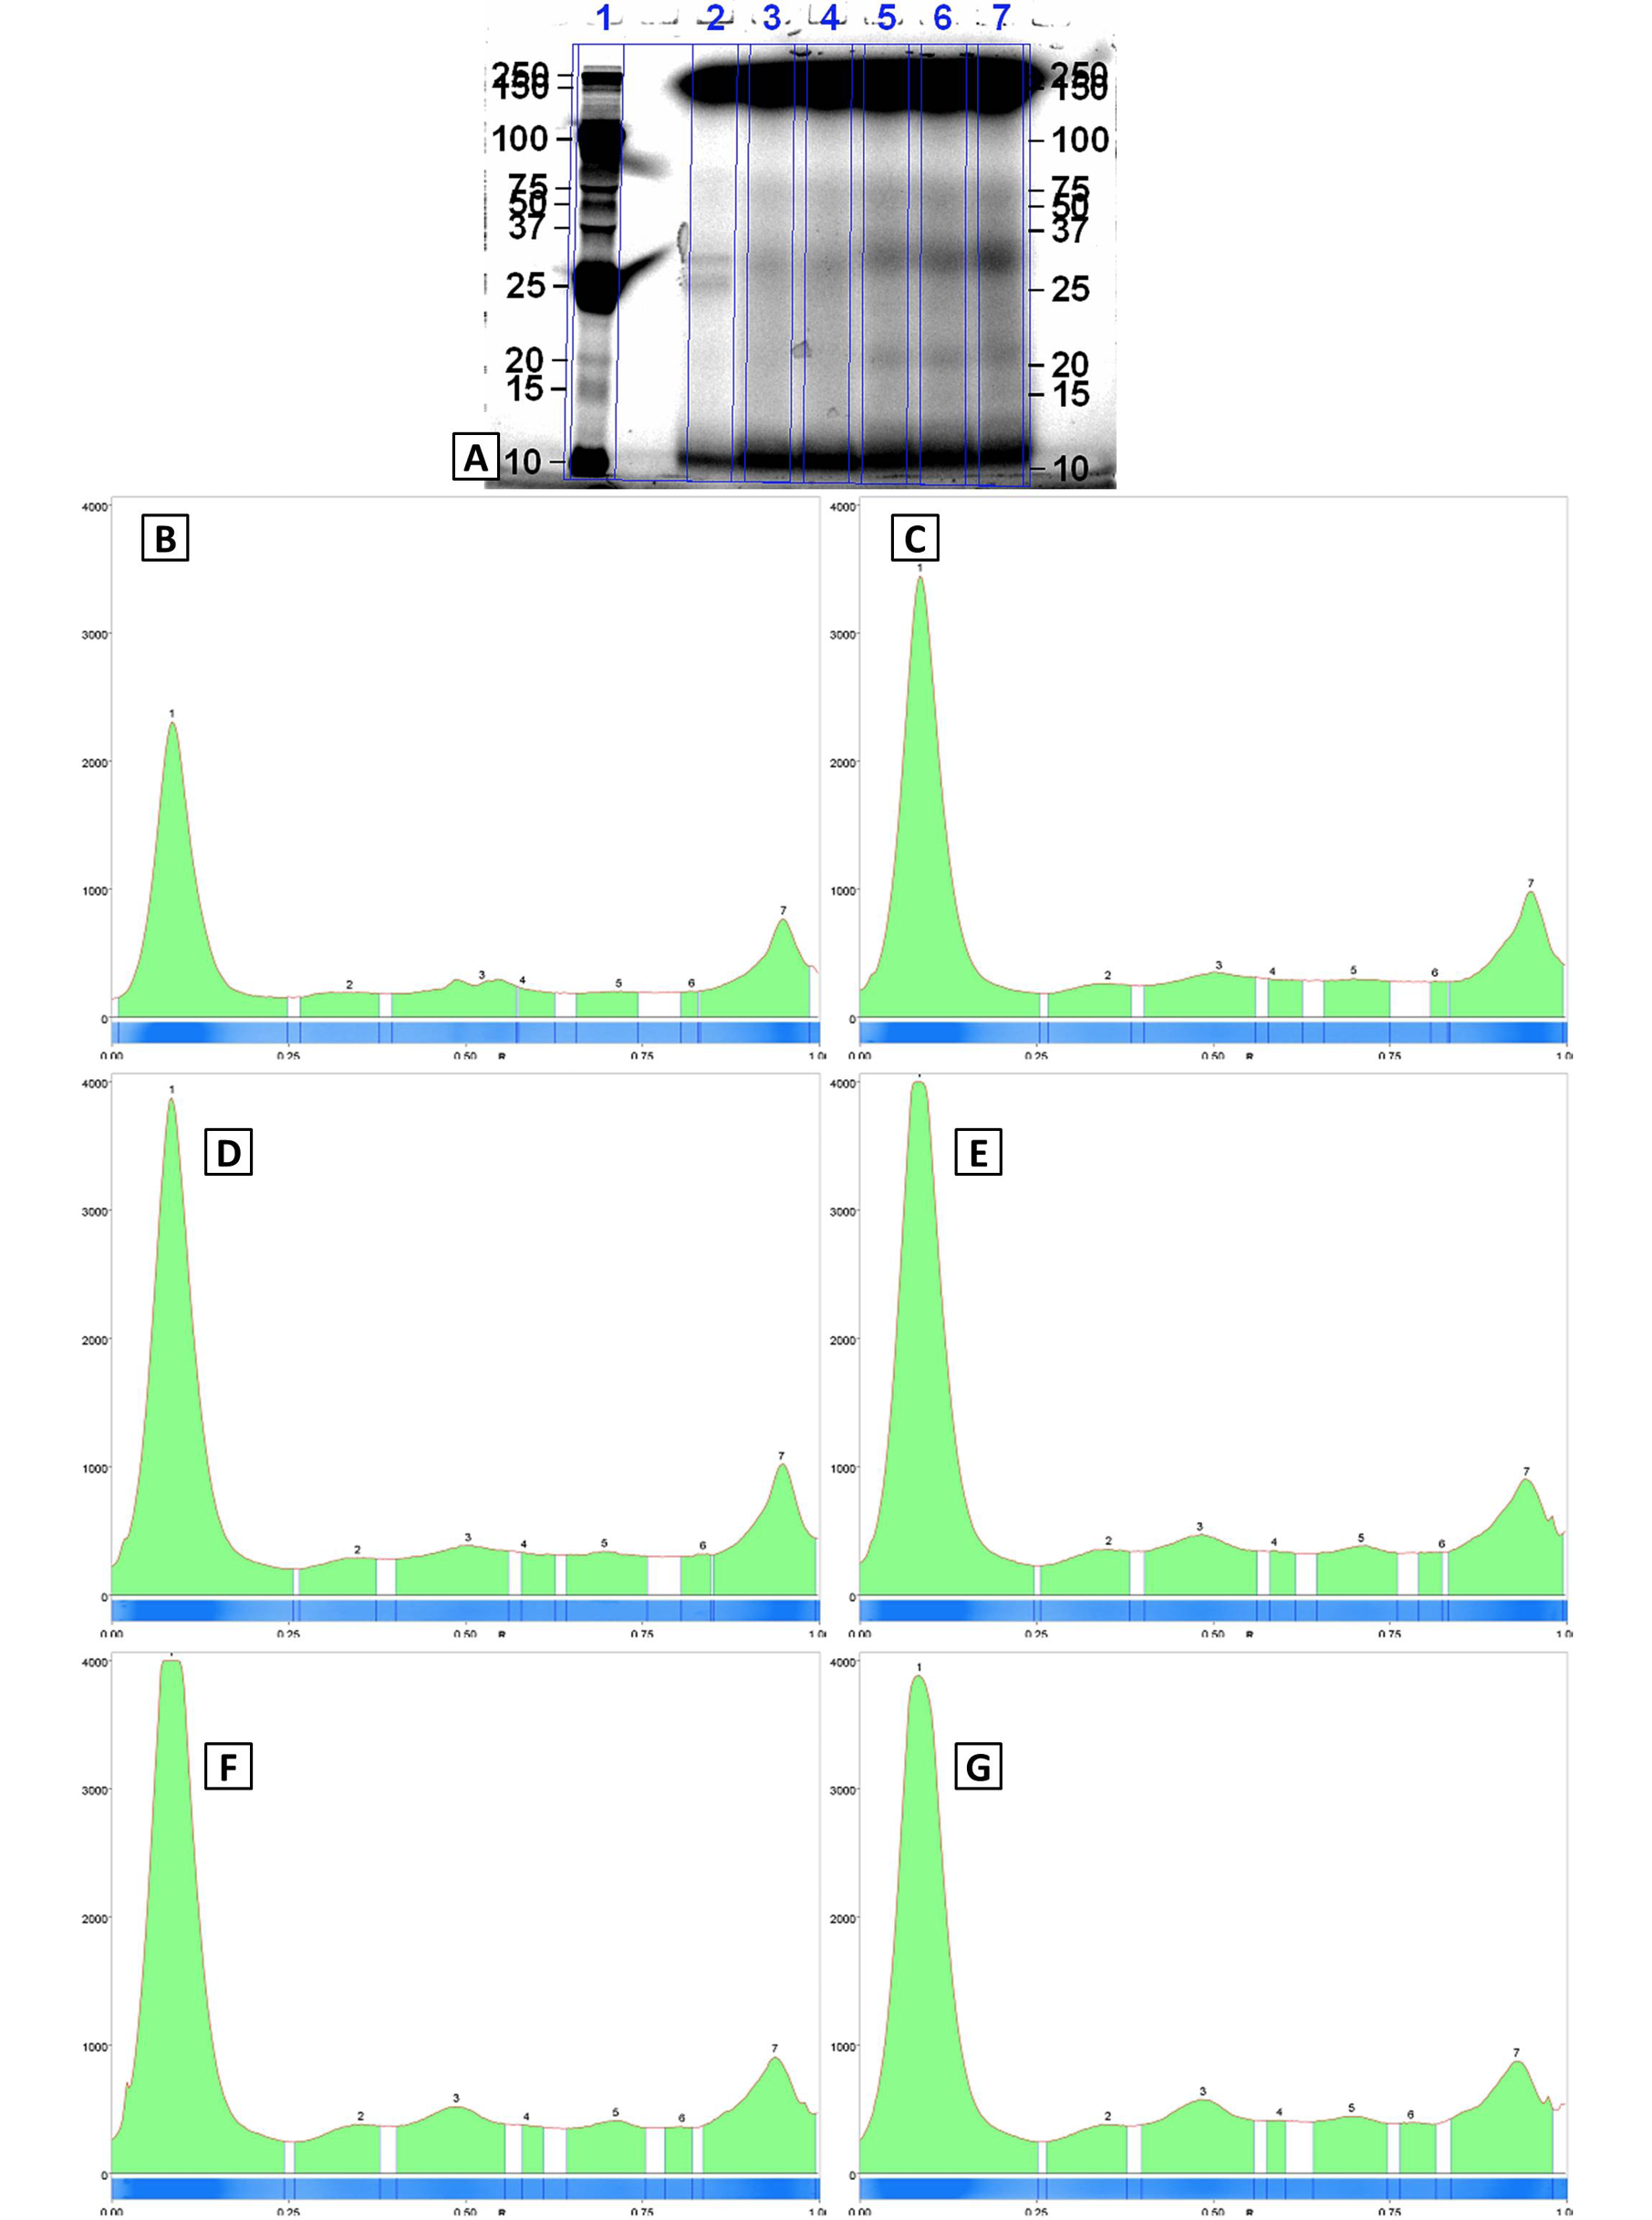
Fig. 3.
Hydrolysate densitograms of the viscera hydrolysates and the electrophorogram. A, molecular weight marker; B, Control (0 min); C, 30 min; D, 60 min; E, 90 min; F, 120 min; G, 180 min (BioRadImageLab 4.01 gel analysis software program).