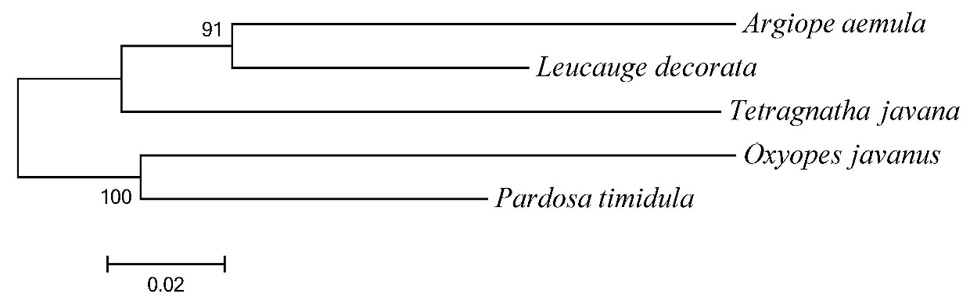
Fig. 4.
Molecular phylogenetic analysis of Cytochrome C Oxidase subunit 1 from query spider species. The scale bar represents the sequence divergence. Bootstrap values (100 replicates) are shown at the nodes.
Molecular phylogenetic analysis of Cytochrome C Oxidase subunit 1 from query spider species. The scale bar represents the sequence divergence. Bootstrap values (100 replicates) are shown at the nodes.