View larger version:
Download Original File
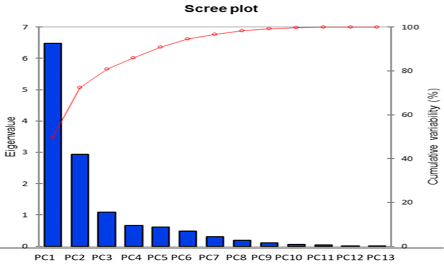
Figure 1:
Scree plot presenting PCs with their cumulative variability.
