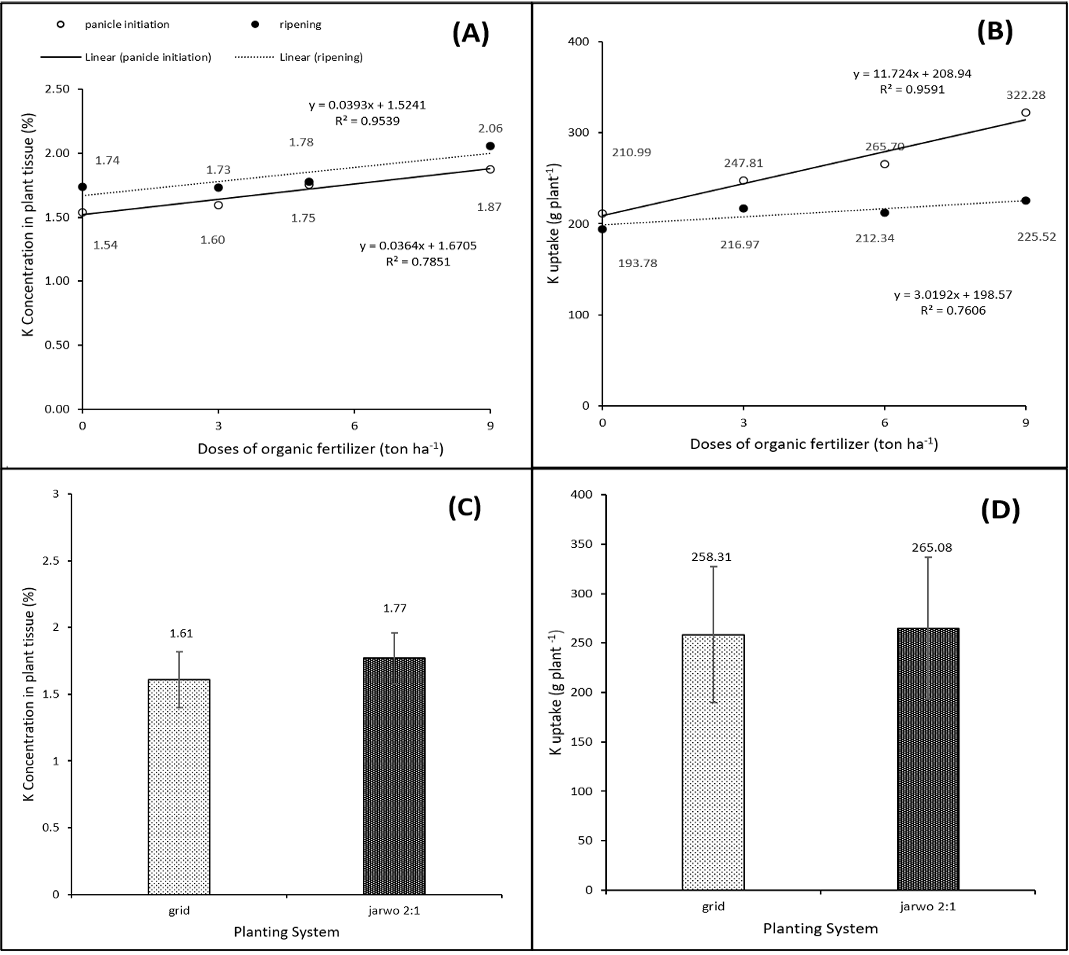
Figure 5:
Phosphate concentration (a) in plant tissue and Phosphate uptake (b) at different doses of organic fertilizer. Phosphate concentration (c) in plant tissue and Phosphate uptake (d) at different cropping systems. Error bars represent standard deviation. Arrows of continuous and dotted lines show the trend between doses of organic fertilizer and NPK in whole plant.