
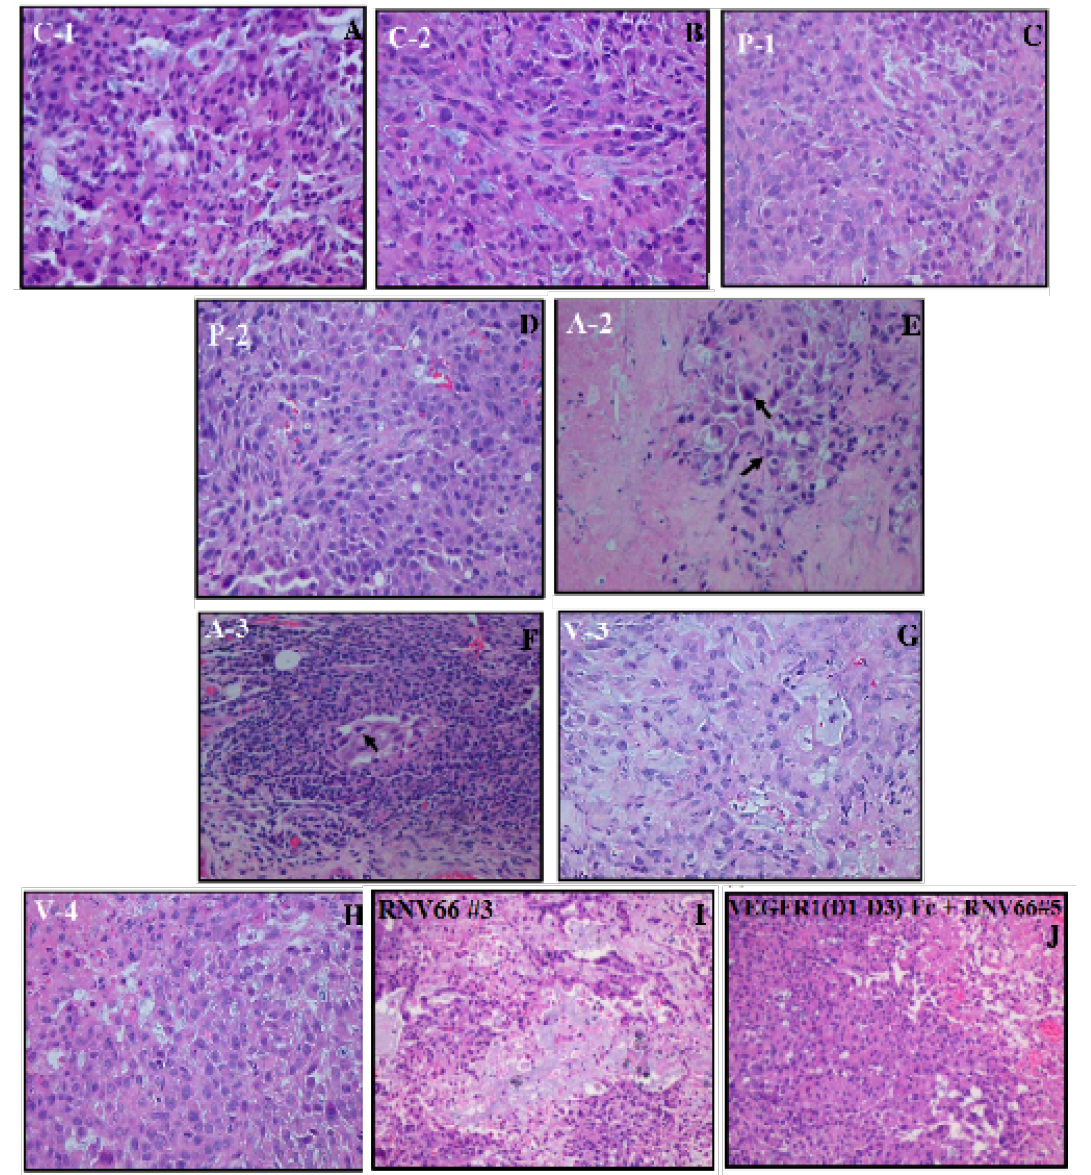
Figure 6
Representative images of histological sections of tumors.
(A, B) Images of C-1 and C-2 which represent sections from control (untreated) tumors; (C, D) Images of P-1 and P-2 which represent
placebo-treated tumors; (E, F) Images of A-3 and A-4 which represent aflibercept-treated tumors; (G, H) Images of V3 and V-4 which represent
VEGFR1(D1-D3)-Fc-treated tumors. (I) Image of RNV66#3, which represents aptamer-treated tumor in animal#3; (J) Image of
VEGFR1(D1-D3)-Fc and RNV66# 5, which represents animal#5 which received a combination of VEGFR1(D1-D3)-Fc and aptamer, as
treatment. Arrow heads indicate tumor cells in a pool of normal cells