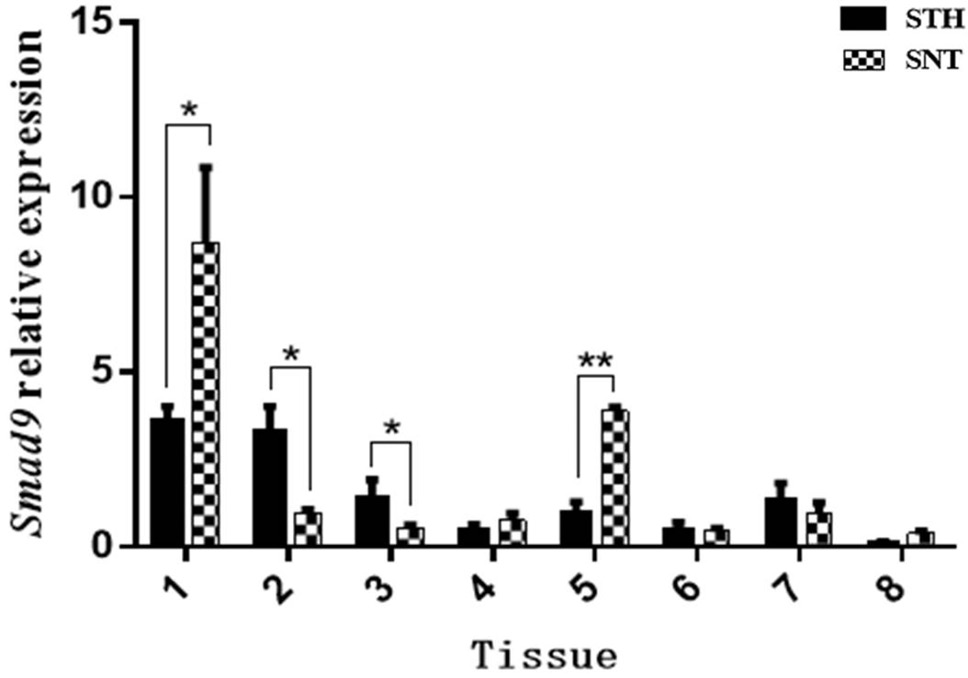
Fig. 6.
Comparison of the expression of Smad9 in eight tissues (Tissues 1–8: brain, cerebellum, hypothalamus, pituitary, testis, epididymis, vas deferens, and adrenal gland, respectively) between STH and SNT. Means with different superscripts are significantly different. The significant results with a p-values lower than 0.01 and 0.05 are given two asterisks (**) and one asterisk (*), respectively.