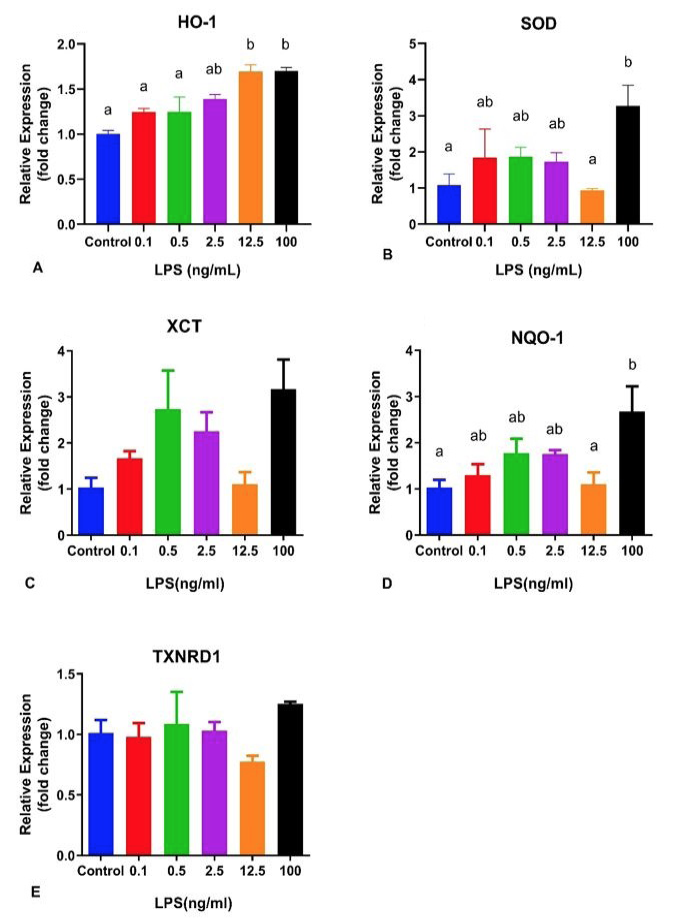
Fig. 5.
Effects of different LPS levels on the relatively expression of antioxidative genes in MAC-T cells. Columns without a common lowercase letter (a, b) indicate significant difference among treatments (P < 0.05). HO-1, hemeoxygenase 1; SOD, superoxide dismutase; XCT, cysteine uptake transporter; NQO-1, NADPH-quinone oxidoreductase; TXNRD1, thioredoxin reductase 1.