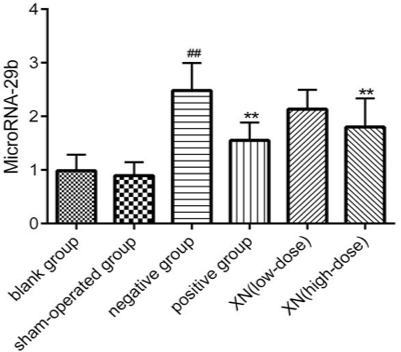
Fig. 5.
The effect of XN on the expression of microRNA-29b in ICH rats. Bar graph showing the change in microRNA-29b protein expression in the blank, sham-operated, model, AGNH group and XN-treated (low/high doses) groups. Data represented as mean±SEM (#P<0.05, ##P<0.01, versus sham-operated group; *P<0.05, **P<0.01, versus model group); data analyzed using six independent experiments (n=6).