
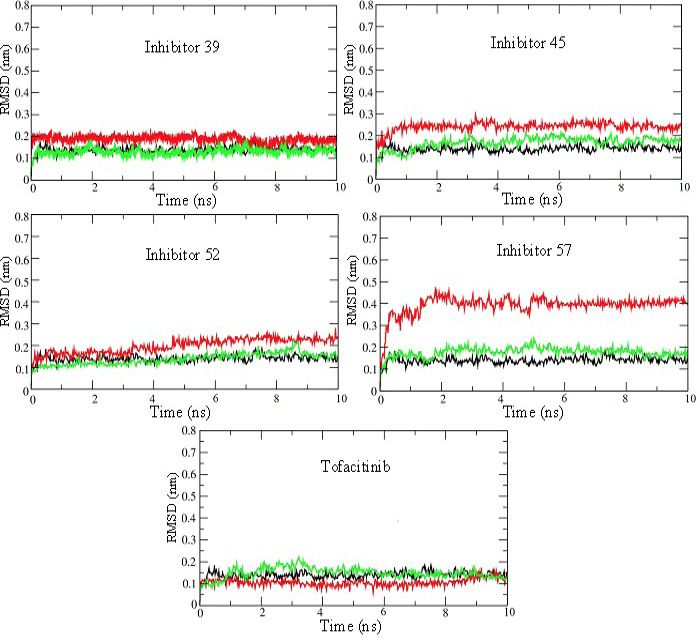
Figure 14:
RMSD plots for 10 ns MD production run of simulations for JAK3 enzyme-inhibitor complexes. RMSD plots for the unbound enzyme (black), inhibitor (red), and enzyme bound with inhibitor (green) have been shown for selected inhibitors 39, 45, 52, 57, and Tofacitinib. These plots show that the systems attain stability very quickly and remain at steady-state throughout 10 ns simulations.