View larger version:
Download Original File
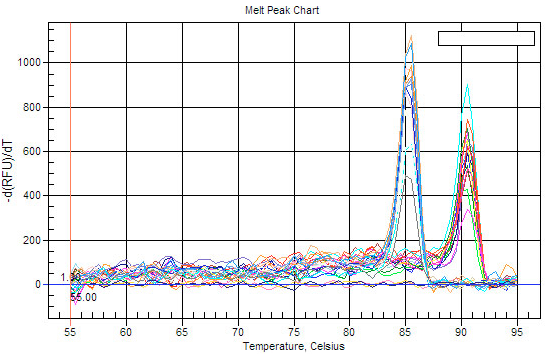
Fig. 2.
Melt curve analysis of BPI and β-actin PCR product.