
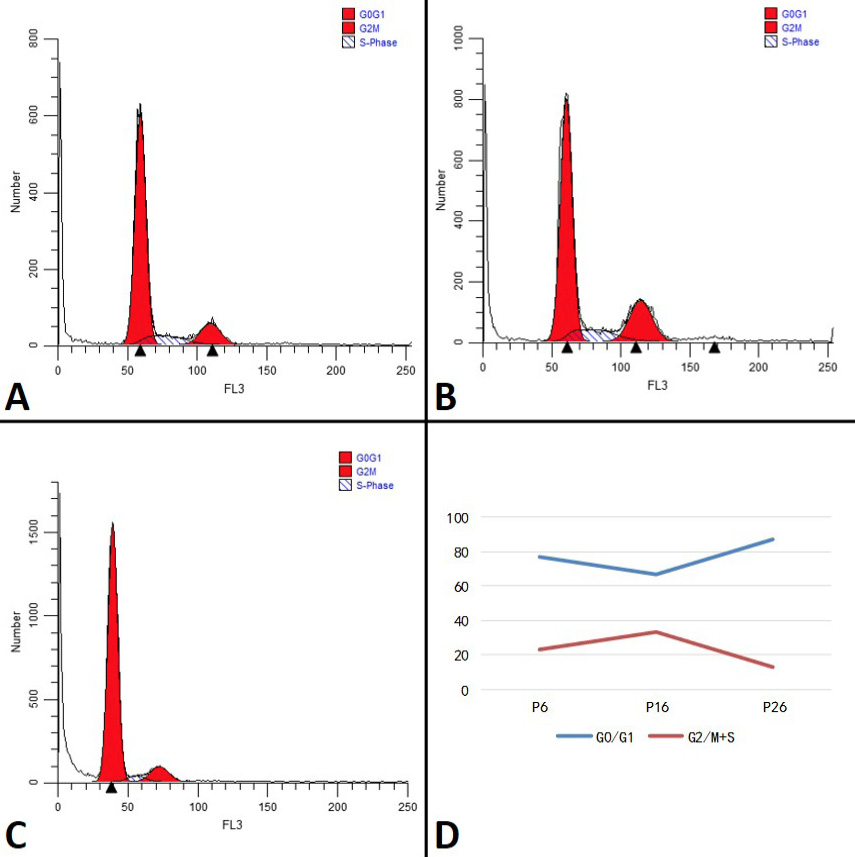
Fig. 7.
Examination of cell cycle. A, cell quantities that lie in G0/G1, S and G2/M of P6 CAFSCs, respectively; B, cell quantities that lie in G0/G1, S and G2/M of P16 CAFSCs, respectively; C, cell quantities that lie in G0/G1, S and G2/M of P26 CAFSCs, respectively; D, line chart of G0/G1 and G2/M+S statistics. S phase represent DNA replication stage, G2/M represent cell division stage, G2/M+S can reflect cell proliferation vigor.