
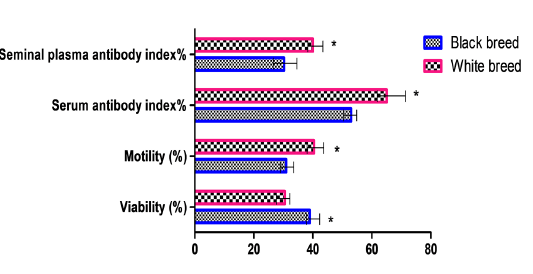
Figure 3
Breeds dependent relations of sperm viability (%) and motility (%) to antibody index %. Bars represent mean ± SE of groups statistically analyzed and marked by * as significantly different from respective items at P ≤ 0.05.
Breeds dependent relations of sperm viability (%) and motility (%) to antibody index %. Bars represent mean ± SE of groups statistically analyzed and marked by * as significantly different from respective items at P ≤ 0.05.