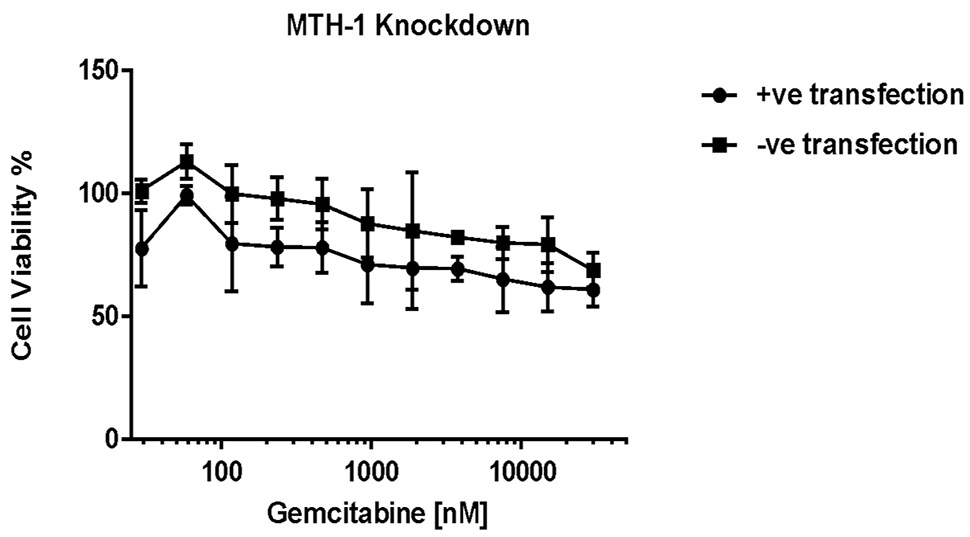
Fig. 2.
Cell viability of MCF7-R cell line after transfection of MTH1 specific siRNA and subsequent treatment with gemcitabine. Y-axis represents the percentage (%) of viable cells and X-axis represent drug concentration in nM at a log 10 scale. Error bars represent standard error of the mean, while Paired t-test provided extremely significant p-value when siRNA +ve and –ve transfected groups were compared.