
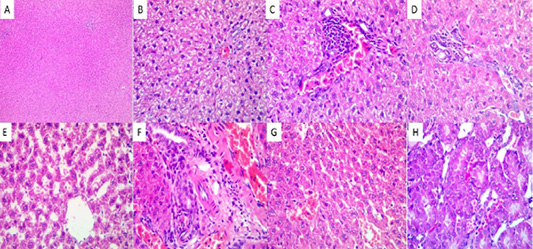
Histopathological results in the liver. (A) The liver of the control rat shows a normal histological picture, H&E, X 40. (B) The liver of diabetic rats showed acute cellular swelling with marked vacuolations, single-cell necrosis, and endothelial hypertrophy, H&E, X 40. (C) The liver of 0.25 mg ZnO NPs treated rat showed vacuolations of the hepatocytes, portal congestion, and mononuclear cell infiltration, H&E, X 40. (D) The liver of 0.5 mg ZnO NPs-treated rats showed vacuolations of the hepatocytes and portal infiltration with few numbers of mononuclear cells, H&E, X 40. (E) The liver of 0.25 mg empagliflozin-treated rats showed notable sinusoidal dilatation with vacuolation of the hepatocytes and few single-cell necroses, H&E, X 40. (F) The liver of a 0.5 mg empagliflozin treated rat shows portal congestion with the presence of few numbers of inflammatory cell infiltrates, H&E, X 40. (G) the liver of 0.25 mg ZnO NPs + 0.25 mg empagliflozin-treated rats showed mild sinusoidal dilatation and vascular congestion, H&E, X 40. (H) The liver of 0.5 mg ZnO NPs + 0.5 mg-empagliflozin-treated rats showed an almost normal histological picture except for mild vascular congestion, H&E, X 40.