
Visualization of Borna Disease Virus Protein Interactions with Host Proteins using in situ Proximity Ligation Assay


Visualization of Borna Disease Virus Protein Interactions with Host Proteins using in situ Proximity Ligation Assay
Jonas Johansson Wensman1*a, Karl-Johan Leuchowius2,3 a, Jiting Yan1, Anna-Lena Berg4, Liv Bode5, Hanns Ludwig5, Sandor Belak6, Ulf Landegren2, Ola Soderberg2, Mikael Berg6

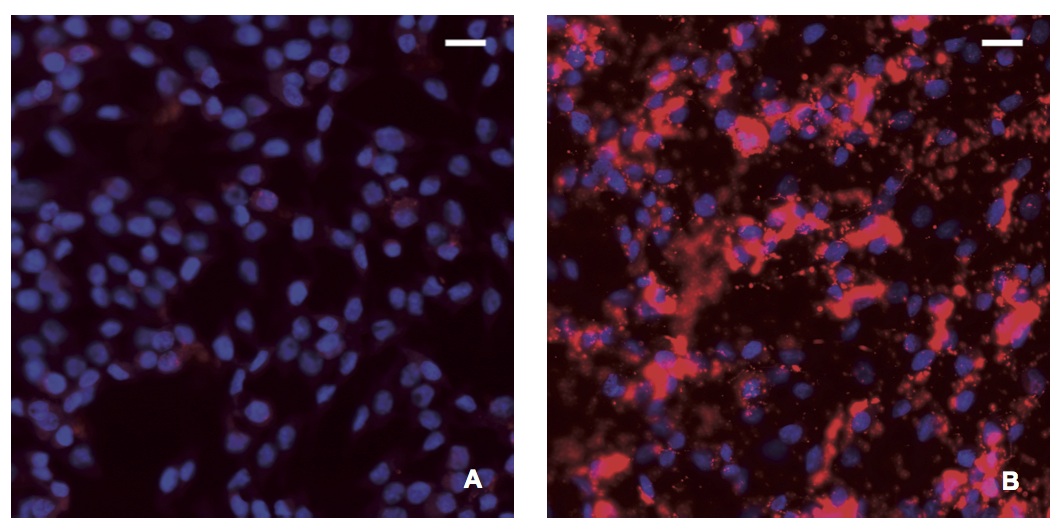
Detection of BDV P using in situ PLA in cell cultures
In situ PLA using a rabbit polyclonal anti-BDV P antibody and a monoclonal anti-BDV P antibody (dilution 1:100) was performed in A) C6 and B) C6BV cell cultures. The in situ PLA signals (BDV P) are seen as red dots, nuclei are blue. Notice the oversaturated staining of BDV P, especially in nuclei of C6BV, resulting from several in situ PLA signals coalescing. Magnifications: lens x20.

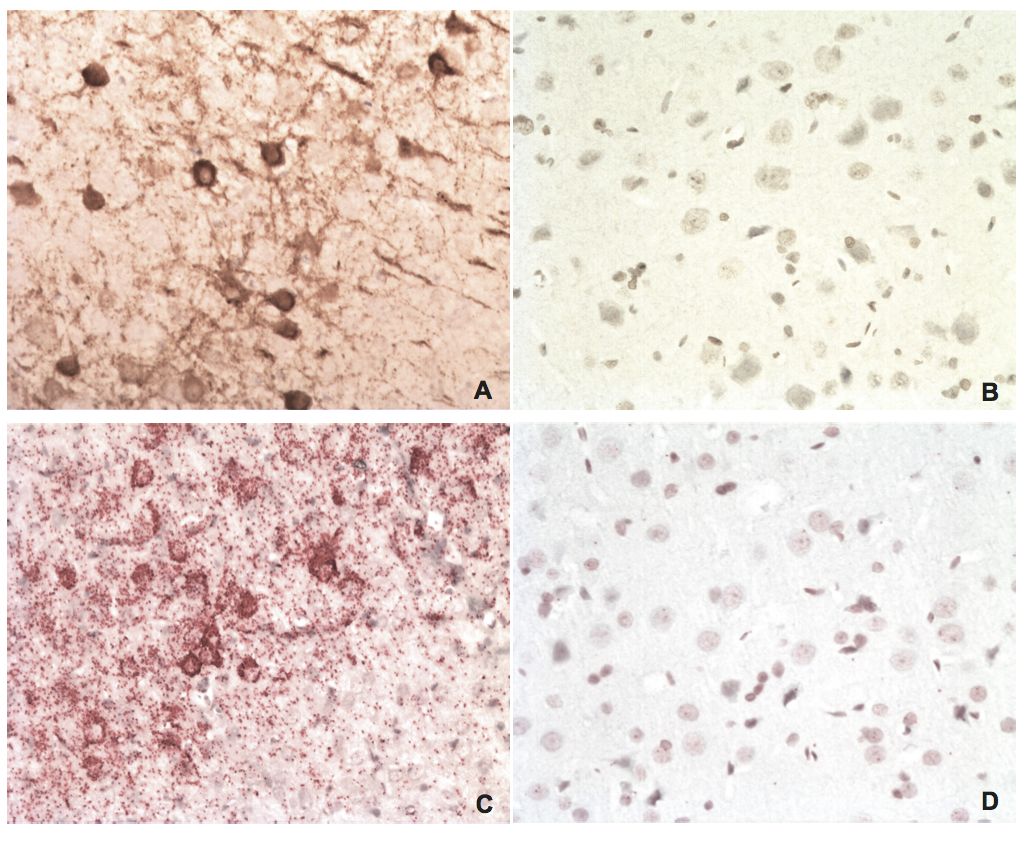
BDV P IHC and in situ PLA on brain tissues from an experimentally infected rat and an uninfected control
A) IHC of BDV P on brain tissue from an experimentally infected rat using a rabbit polyclonal anti-BDV P antibody. The brown staining is BDV P. B) IHC of BDV P on brain tissue from an uninfected control rat. C) In situ PLA of BDV P on brain tissue from the same rat as in A, using rabbit polyclonal and mouse monoclonal anti-BDV P antibodies. The red staining is BDV P. D) In situ PLA of BDV P on brain tissue from the same uninfected control rat as in B. Magnifications: lens x20.

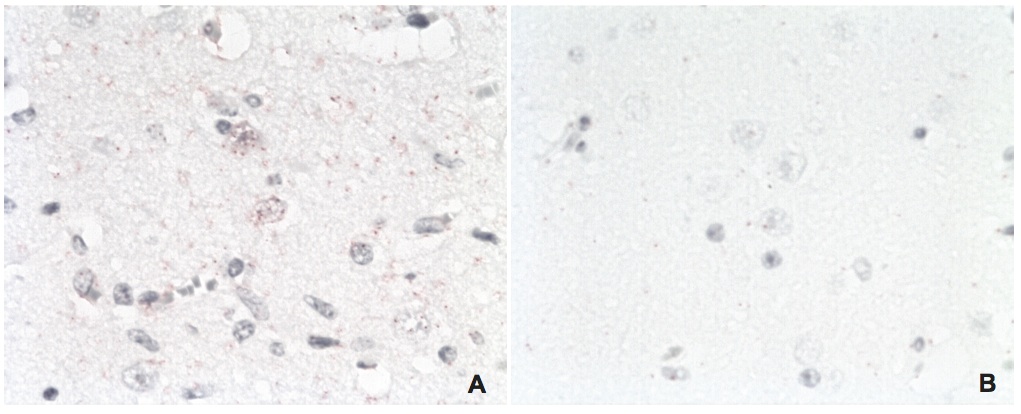
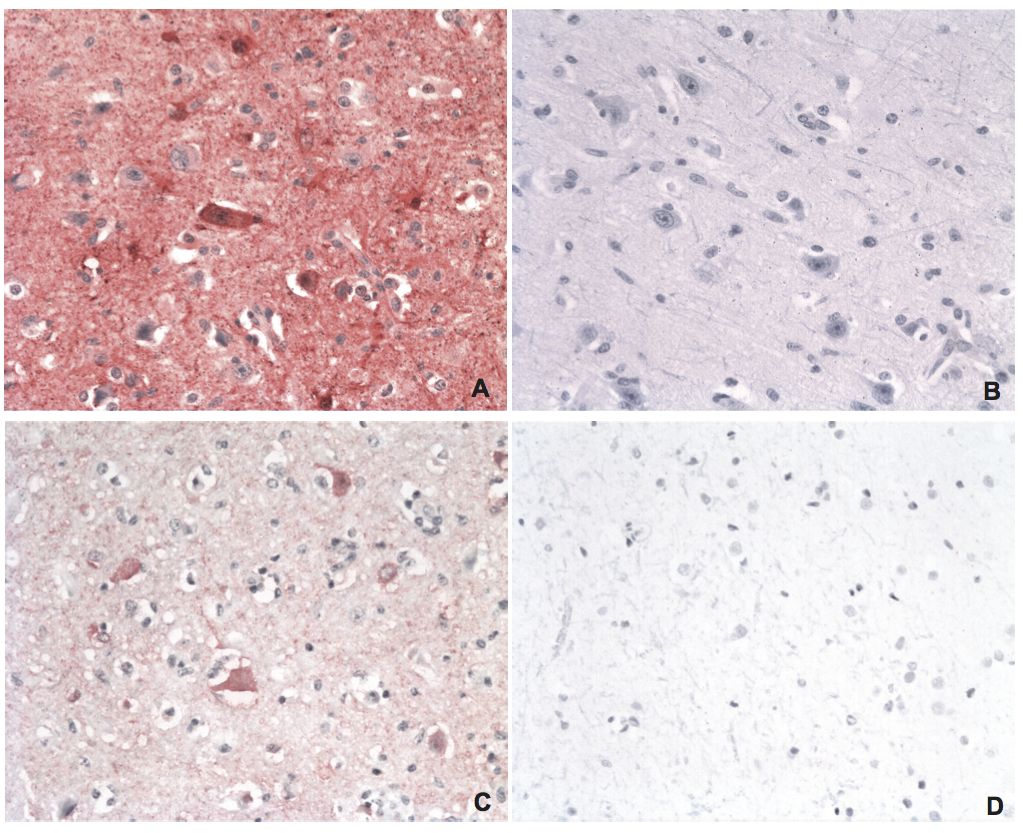
BDV P IHC and in situ PLA on brain tissues from a naturally infected horse and uninfected controls
A) BDV P IHC on brain tissue from a naturally infected horse using a rabbit polyclonal anti-BDV P antibody. The red staining is BDV P. B) IHC of BDV P on brain tissue from an uninfected control horse. C) In situ PLA of BDV P on brain tissue from the same horse as in A, using rabbit polyclonal and mouse monoclonal anti-BDV P antibodies. The red staining is BDV P. D) In situ PLA of BDV P on brain tissue from an uninfected control horse. Magnifications: lens x20.

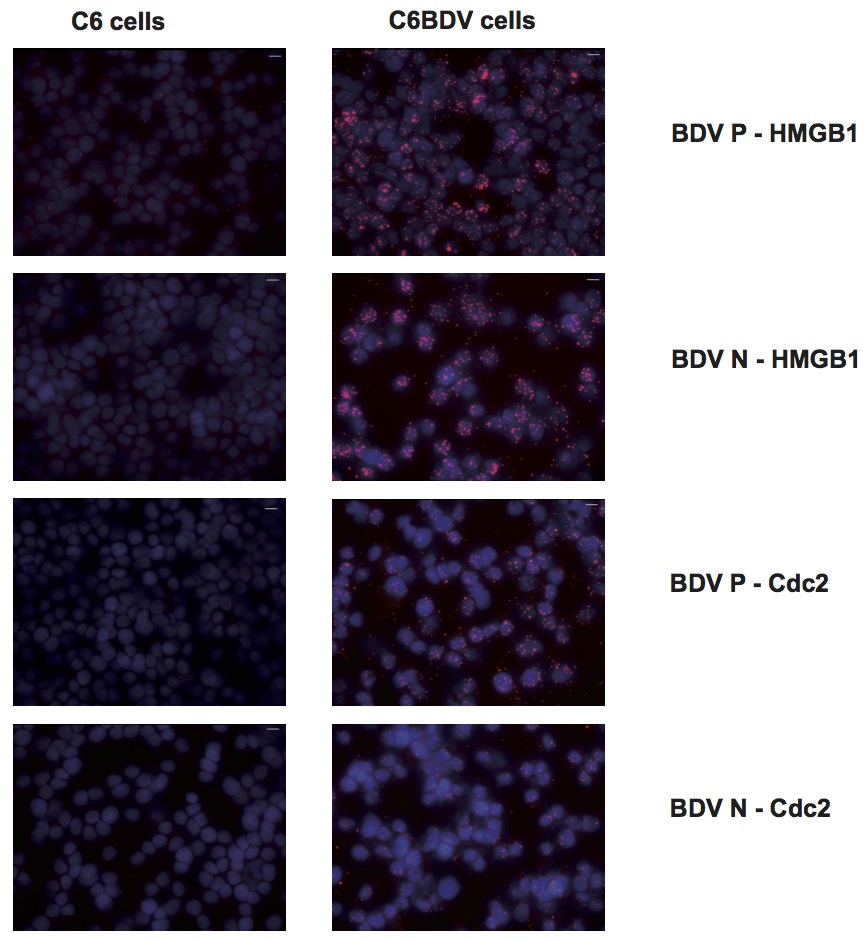
Visualization of host-virus protein-protein interactions in persistently infected cell cultures
In situ PLA for the indicated protein-protein interactions was performed in persistently BDV-infected cell cultures (C6BV), using uninfected C6 cells as negative control. Intense positive signals could be seen in the C6BV cells, especially in the nuclei, compared to the C6 cells. The number of signals per cell was quantified using Duolink ImageTool. The results of the quantifications are shown in Figure 5.

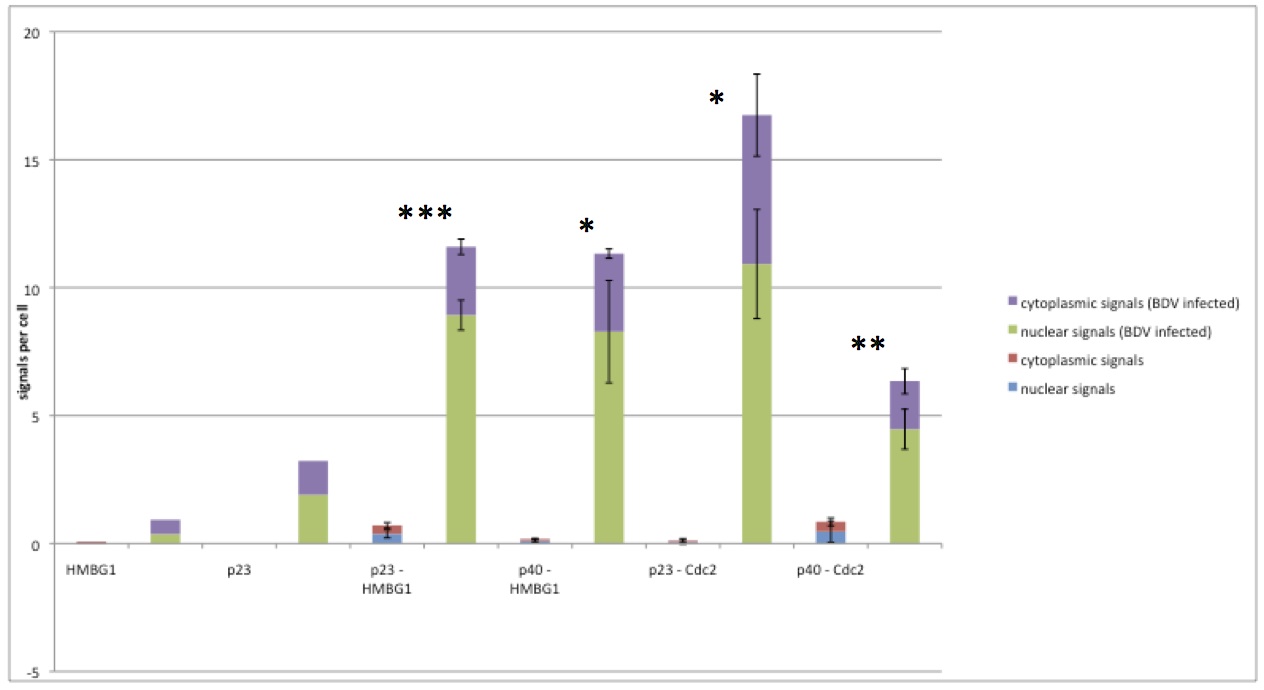
Quantification of host-virus protein-protein interactions in persistently infected cell cultures
The images of the same experiments as shown in Figure 4 were analyzed using Duolink ImageTool (Olink Bioscience). In total, three images were analyzed for each interaction. The number of signals per cell is shown as the cumulative nuclear (green for C6BV cells, blue for C6 cells) and cytoplasmic (purple for C6BV cells, red for C6 cells) signals of the indicated interaction. To the left, two technical controls are shown, where only one of the primary antibodies (as indicated) was used. All other steps were the same as for all other interactions. Statistical analysis (Student’s t-test) was performed using Microsoft Excel, where * indicates p≤0.05, ** p≤0.01 and *** p≤0.001. p23 = BDV P. p40 = BDV N.

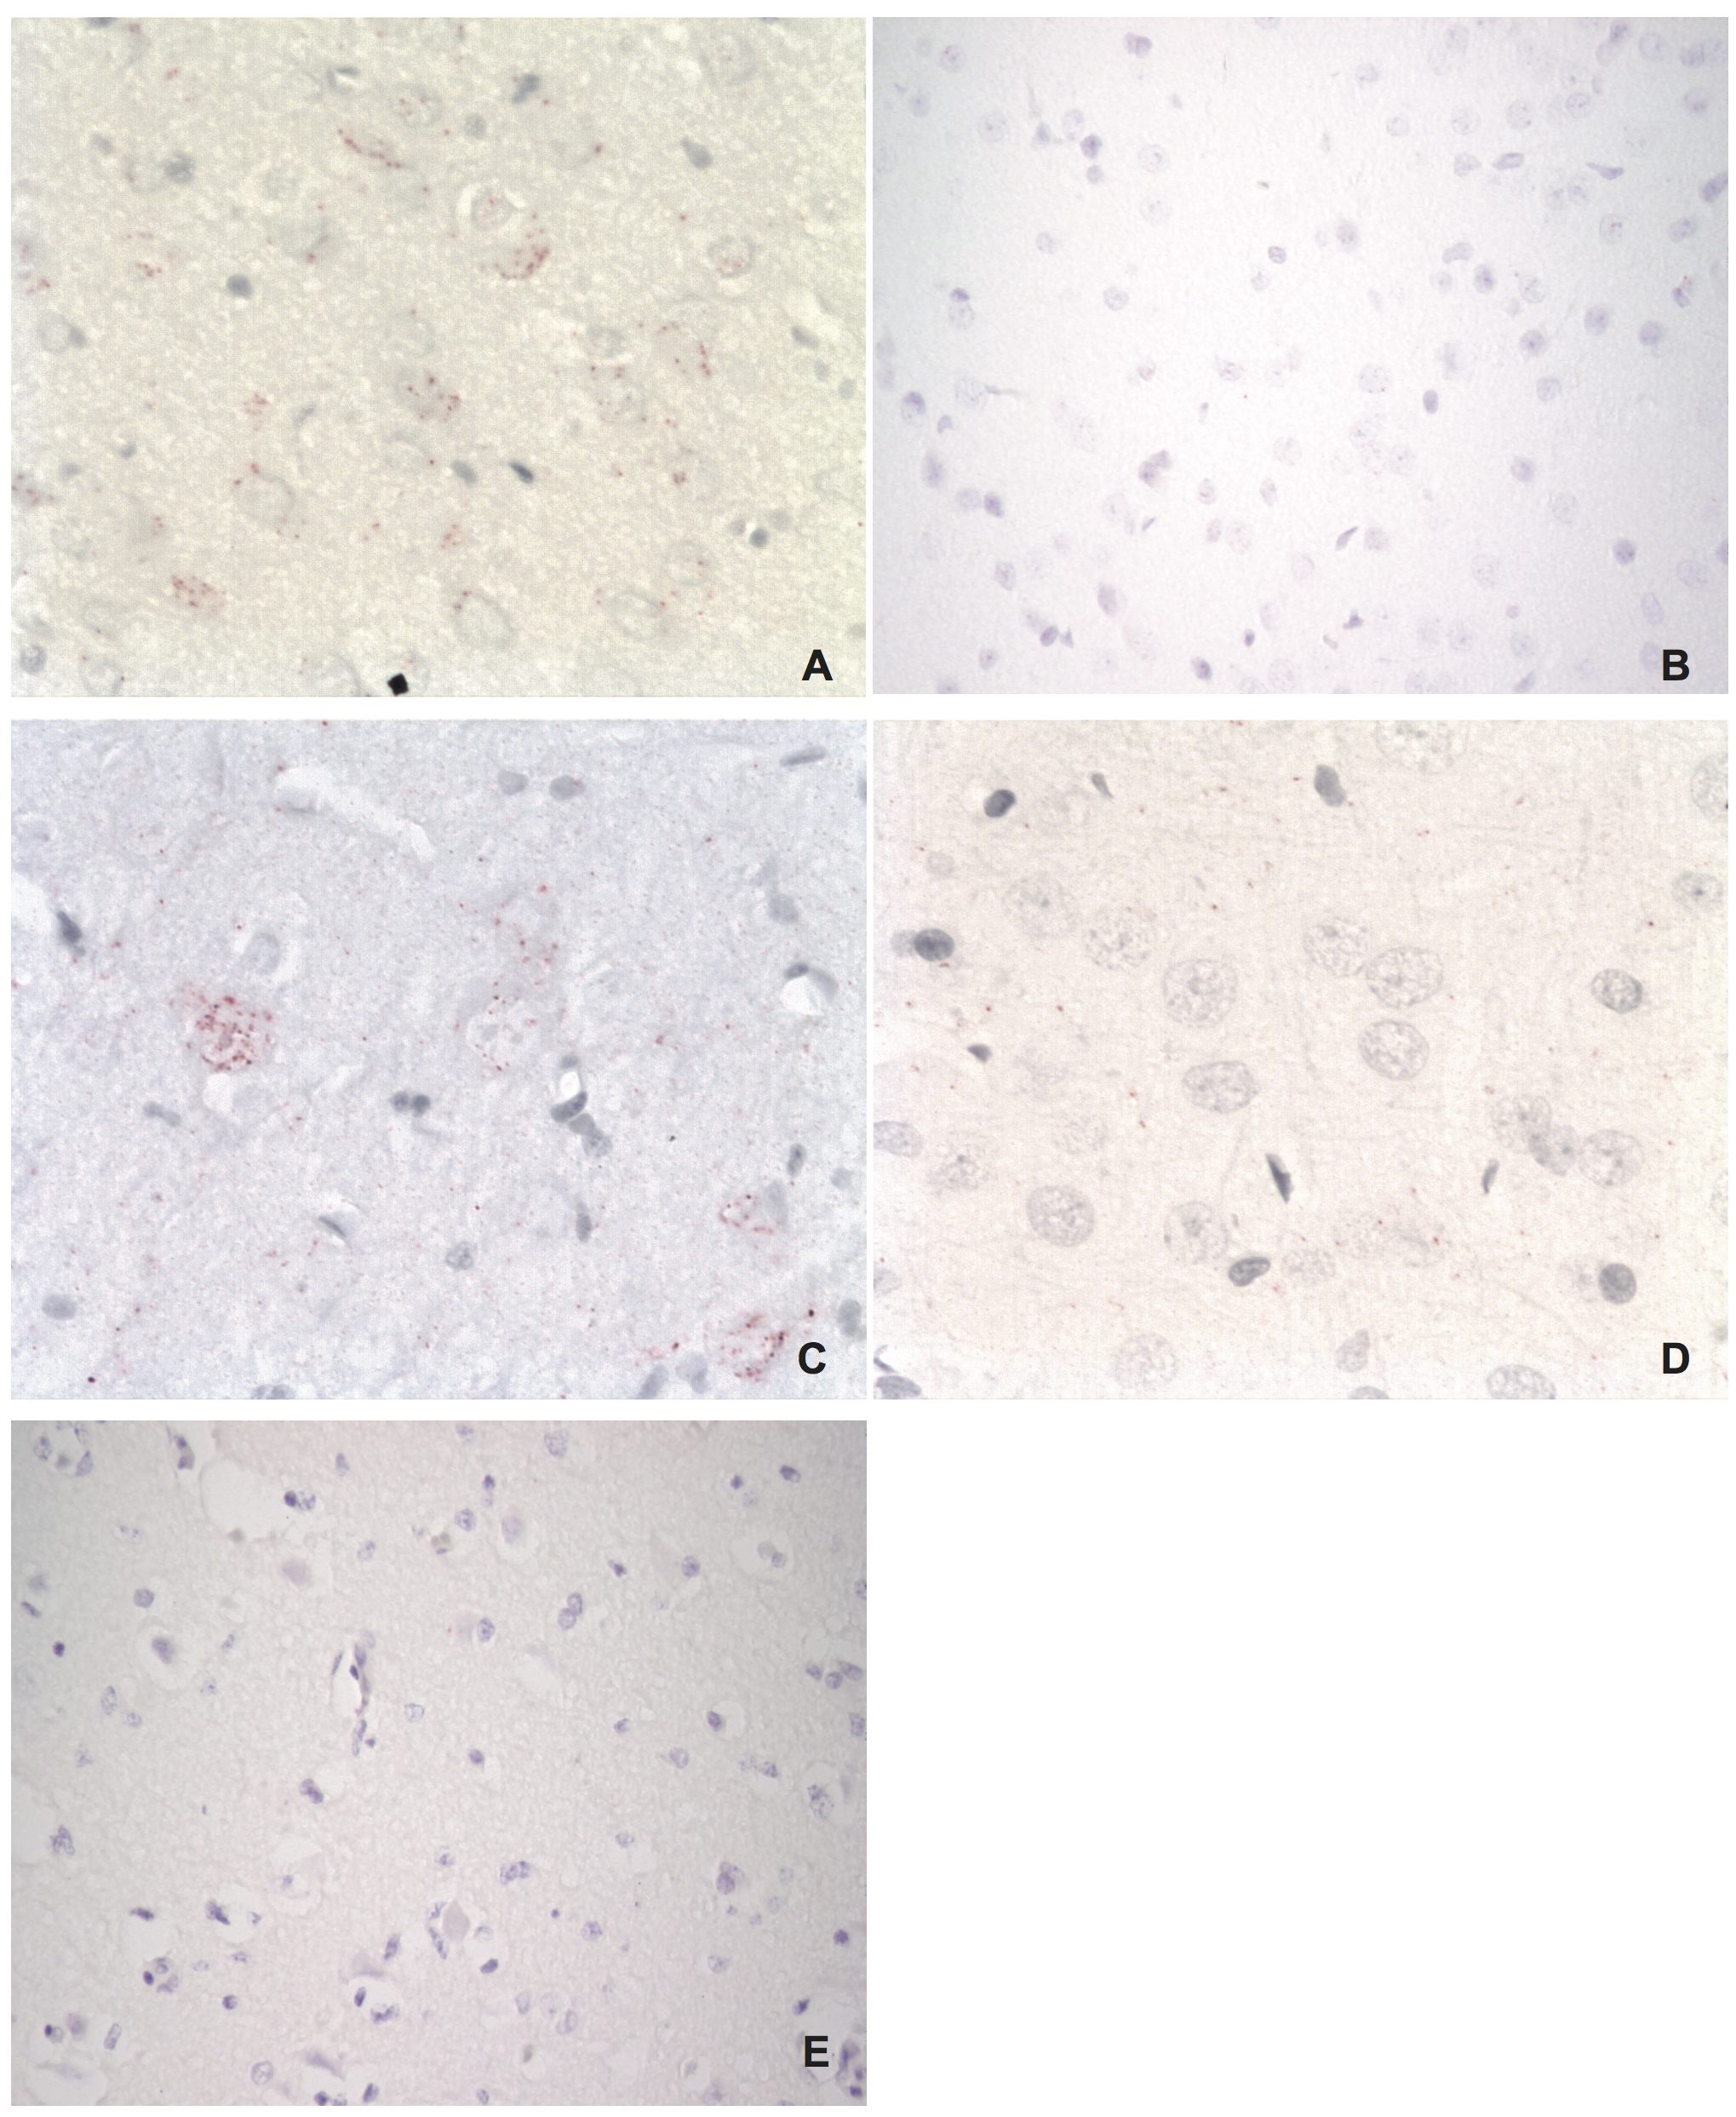
Visualization of host-virus protein-protein interactions in brain tissues of an experimentally infected rat
A) BDV P – HMGB1 interaction (red dots in neuron). B) BDV P – HMGB1 interaction in an uninfected control rat (no signals). C) BDV N – Cdc2 interaction (red dots in neurons). D) BDV N – Cdc2 interaction in an uninfected control rat (no signals). E) Technical control using primary antibody for HMGB1 only in experimentally infected rat. As expected, no signals are seen due to the need for two primary antibodies to obtain a positive in situ PLA reaction. Magnifications: lens x20 (A, C, D), lens x10 (B, E).
Visualization of host-virus protein-protein interactions in brain tissues of a naturally infected horse
A) BDV N – Cdc2 interaction (red dots in neurons). B) BDV N – Cdc2 interaction in an uninfected control horse (no signals). Magnifications: lens x20.
