
Variation in Amino Acid Contents in Chickpea Cultivars in Response to Ascochyta rabiei Infection


Variation in Amino Acid Contents in Chickpea Cultivars in Response to Ascochyta rabiei Infection
Muhammad Usman Ghazanfar1, Waqas Wakil2, Shahbaz Talib Sahi3, Waqas Raza1* and Mahmood Ahmad Randhawa4

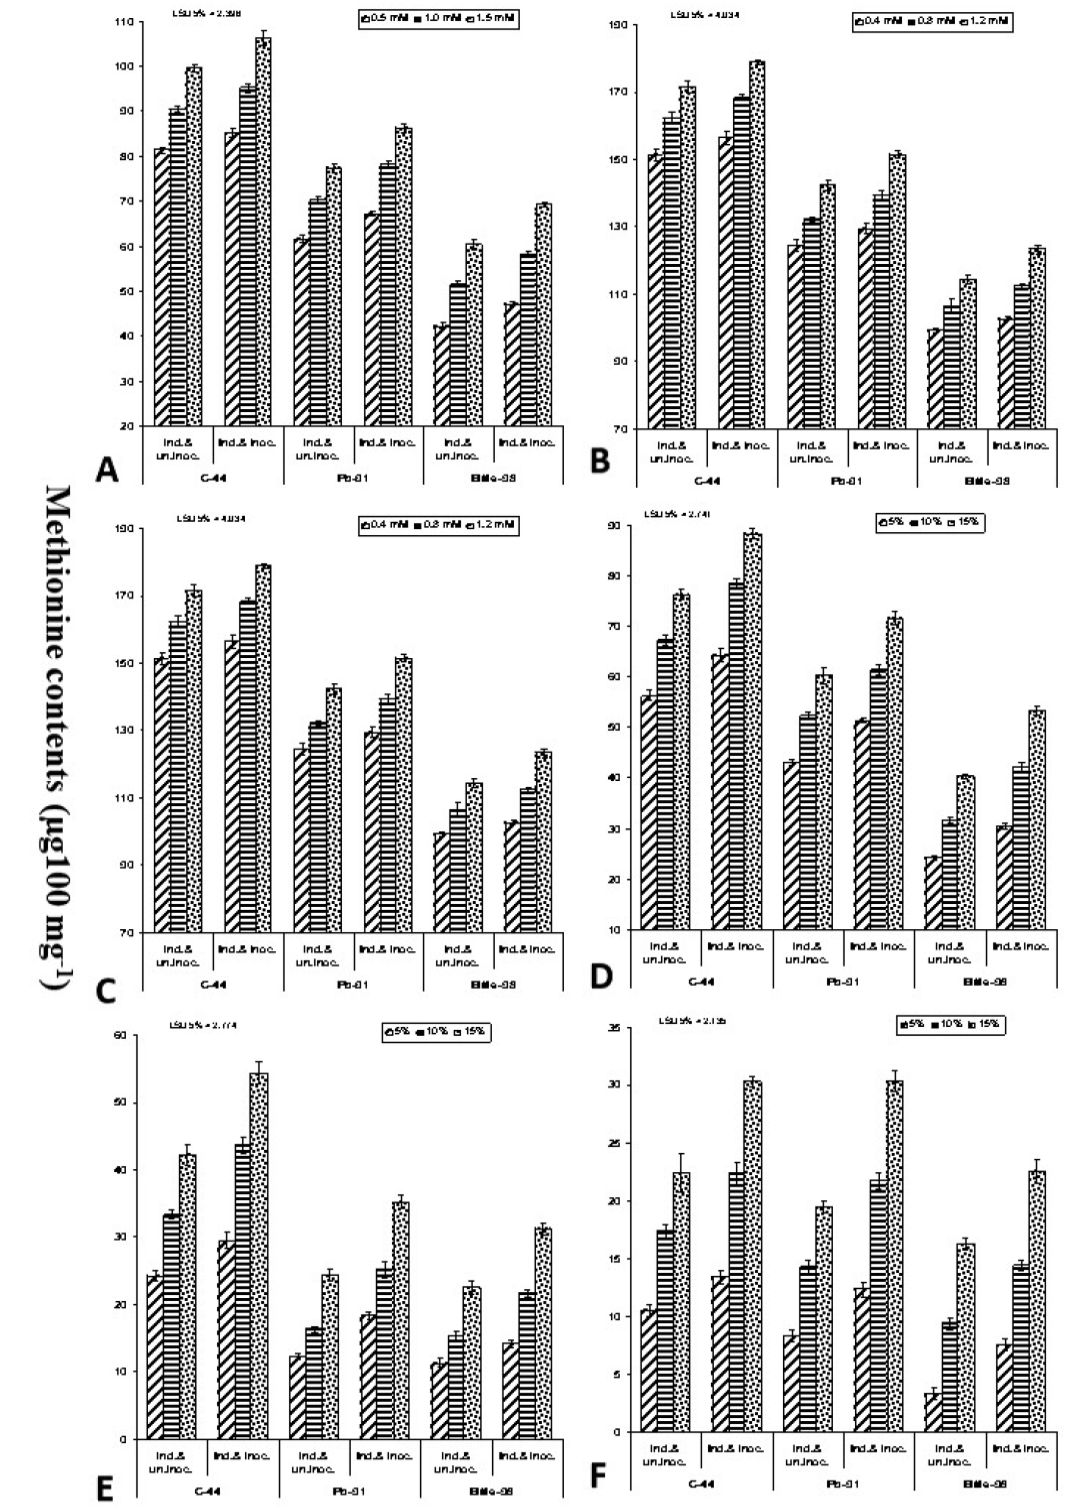
Mean comparison of Methionine contents (µg.100 mg-1) after 14th days of induction of resistance by the application of (A) salicylic acid, (B) Bion, (C) KOH, (D) Neem, (E) Dautra, (F) Garlic and by un-inoculation and inoculation with Ascochyta rabiei in cultivars C-44, Pb-91, Bittle-98. Data are means of three repeated experiments. The error bar represents the standard error of the mean according to the least significant difference test at P ≤ 0.05.

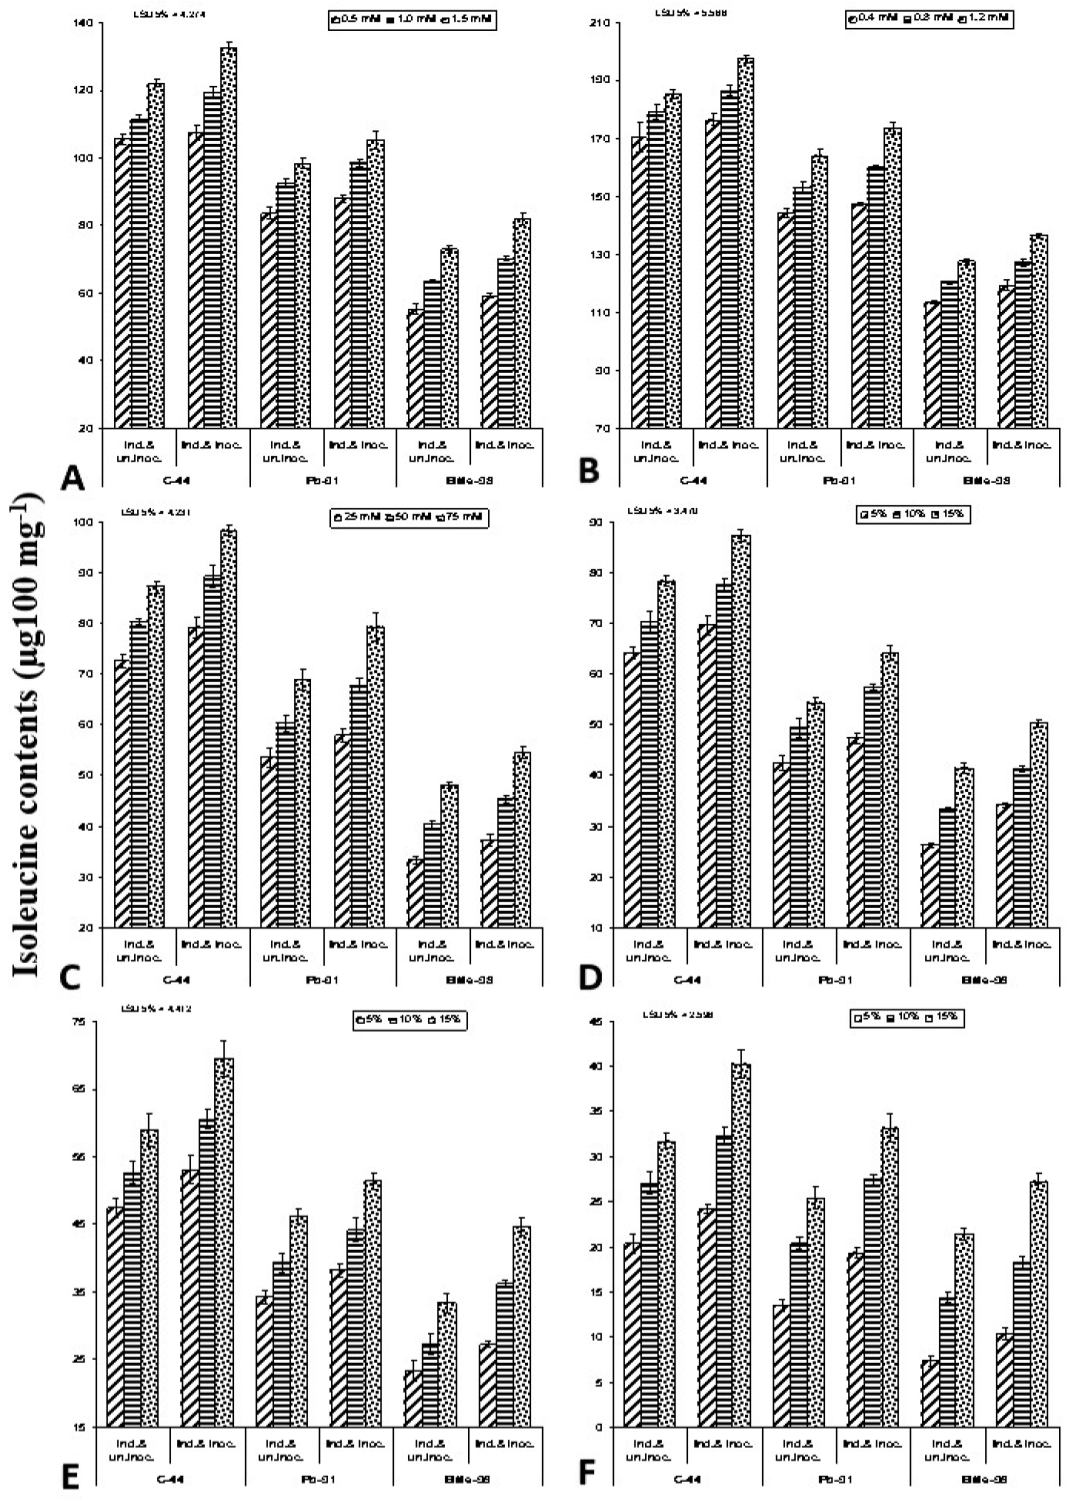
Mean comparison of Isolucine contents (µg.100 mg-1) after 14th days of induction of resistance by the application of (A) salicylic acid, (B) Bion, (C) KOH, (D) Neem, (E) Dautra, (F) Garlic and by un-inoculation and inoculation with Ascochyta rabiei in cultivars C-44, Pb-91, Bittle-98. Data are means of three repeated experiments. The error bar represents the standard error of the mean according to the least significant difference test at P ≤ 0.05.

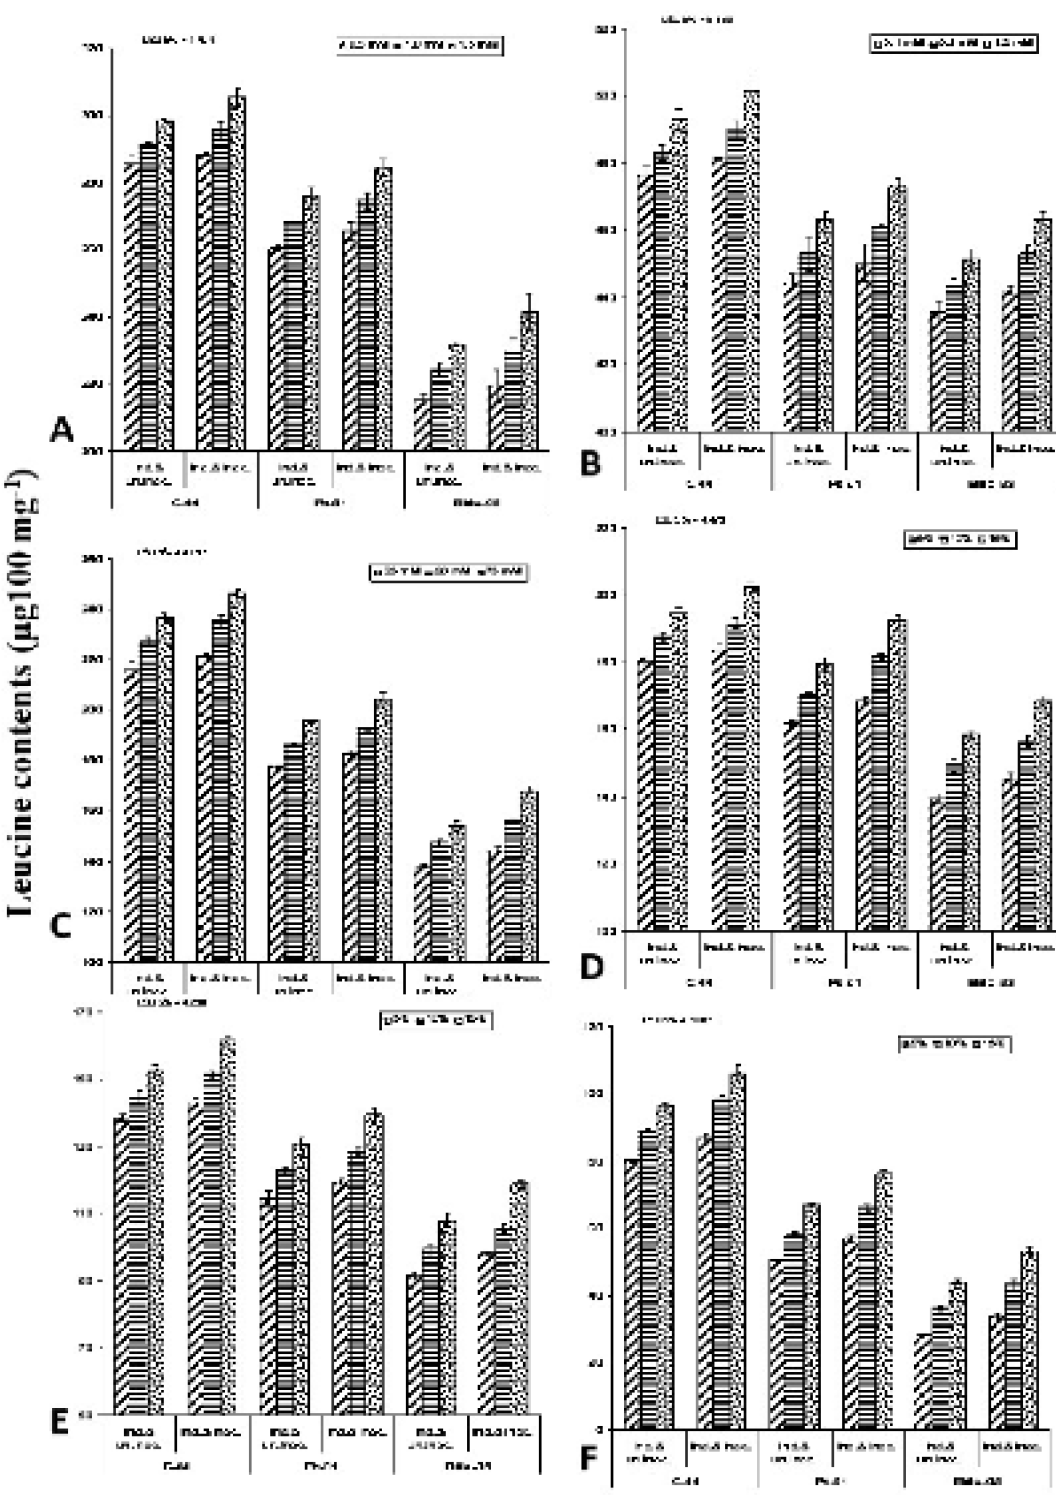
Mean comparison of Leucine contents (µg.100 mg-1) after 14th days of induction of resistance by the application of (A) salicylic acid, (B) Bion, (C) KOH, (D) Neem, (E) Dautra, (F) Garlic and by un-inoculation and inoculation with Ascochyta rabiei in cultivars C-44, Pb-91, Bittle-98. Data are means of three repeated experiments. The error bar represents the standard error of the mean according to the least significant difference test at P ≤ 0.05.

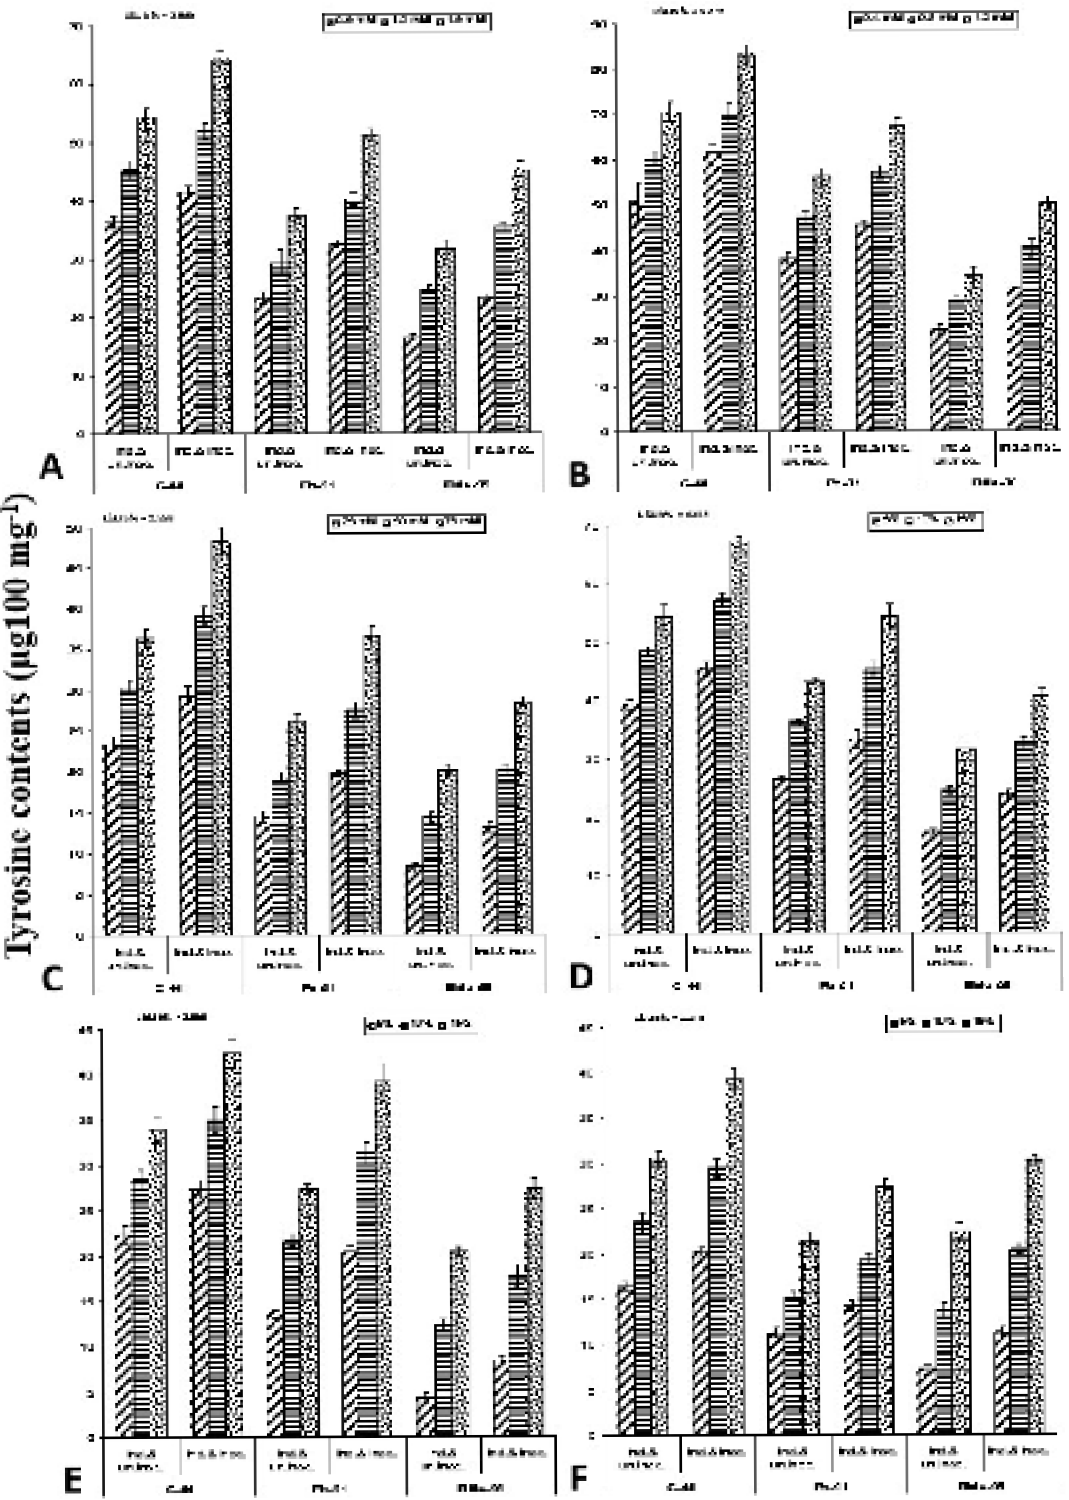
Mean comparison of Tyrosine contents (µg 100 mg-1) after 14th days of induction of resistance by the application of (A) salicylic acid, (B) Bion, (C) KOH, (D) Neem, (E) Dautra, (F) Garlic and by un-inoculation and inoculation with Ascochyta rabiei in cultivars C-44, Pb-91, Bittle-98. Data are means of three repeated experiments. The error bar represents the standard error of the mean according to the least significant difference test at P ≤ 0.05.

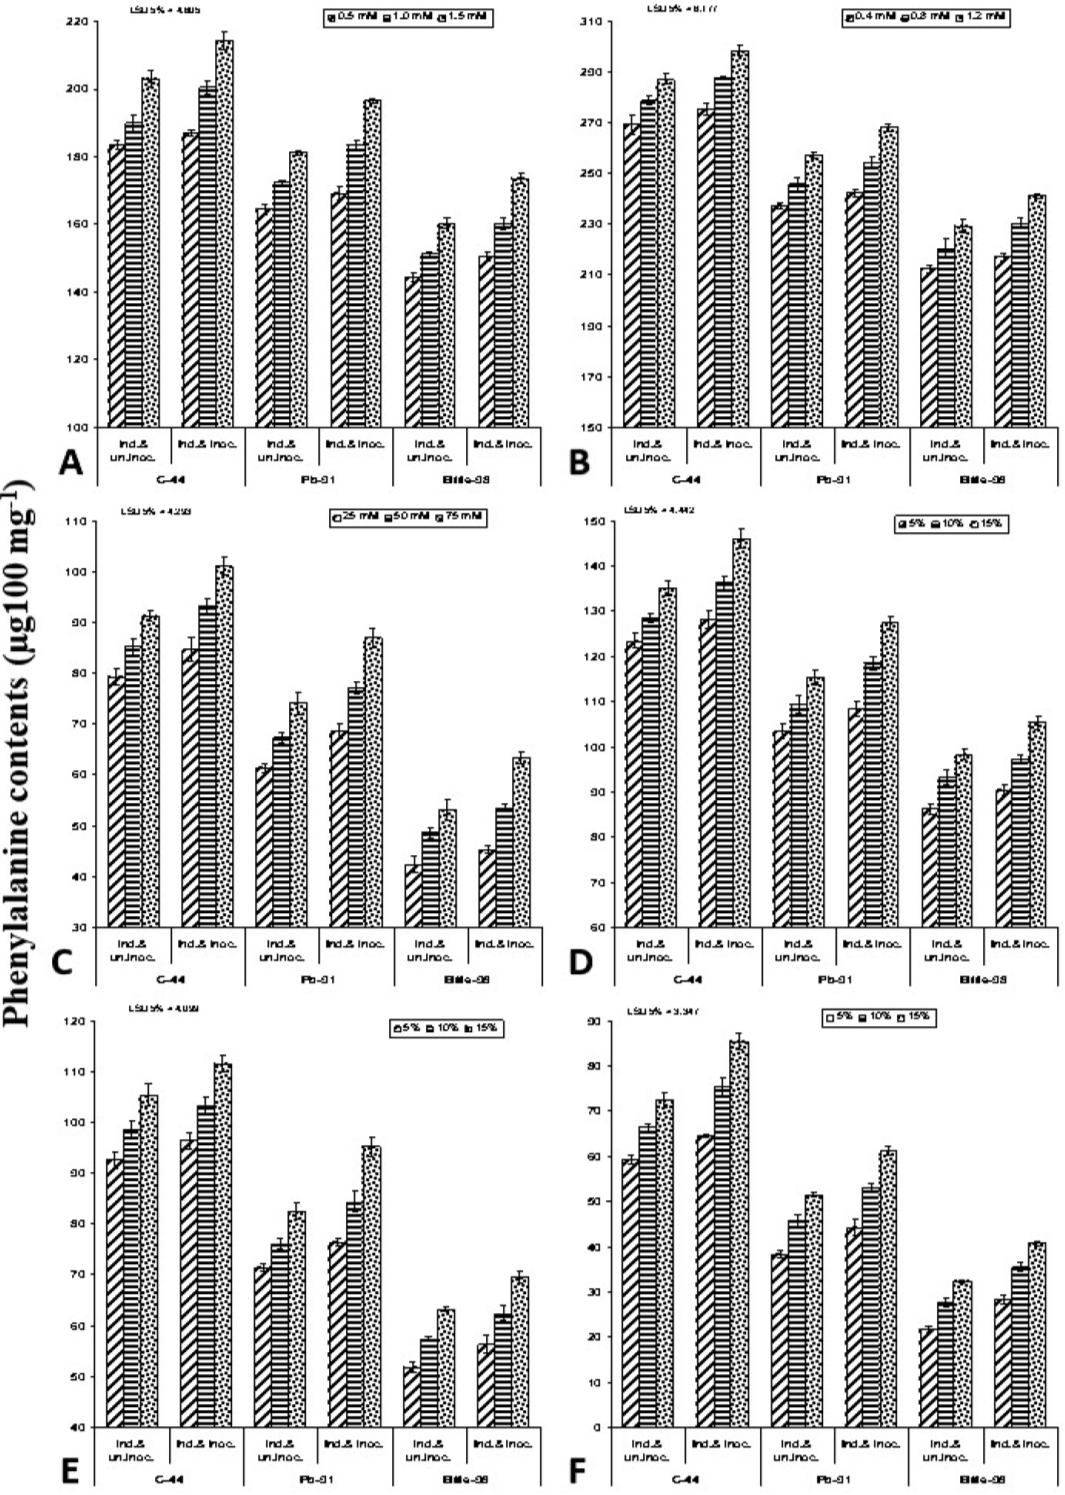
Mean comparison of Phenylalanine contents (µg.100 mg-1) after 14th days of induction of resistance by the application of (A) salicylic acid, (B) Bion, (C) KOH, (D) Neem, (E) Dautra, (F) Garlic and by un-inoculation and inoculation with Ascochyta rabiei in cultivars C-44, Pb-91, Bittle-98. Data are means of three repeated experiments. The error bar represents the standard error of the mean according to the least significant difference test at P ≤ 0.05.


