
Valuation of Massive Artificial Insemination Programs and the Economic Impact for Indonesia


Research Article
Valuation of Massive Artificial Insemination Programs and the Economic Impact for Indonesia
Achmad Firman1*, Sondi Kuswaryan1, Lilis Nurlina1, Muhamad Hasan Hadiana1, Marina Sulistyati1, Unang Yunasaf1, Dwi Cipto Budinuryanto2, Iman Trisman3
1Department of Social Economic Livestock Development, Faculty of Animal Husbandry, Universitas Padjadjaran, Indonesia, Jl. Raya Bandung-Sumedang Km 21, Jatinangor, Sumedang 45363, West Java, Indonesia; 2Department of Livestock Production, Faculty of Animal Husbandry, Universitas Padjadjaran, Indonesia, Jl. Raya Bandung-Sumedang Km 21, Jatinangor, Sumedang 45363, West Java, Indonesia; 3Directorate General Livestock and Health, Ministry of Agriculture, Jl. Harsono RM. No. 3, Ragunan, Jakarta 12550, Indonesia.
Abstract | Indonesian Ministry of Agriculture has made a breakthrough in increasing the cattle population to reduce supply inequality through a massive artificial insemination program (SIWAB/SIKOMANDAN). Previously, the artificial insemination program was carried out partially and not with the feed, health, and community services programs. However, feed, animal health, veterinary public health, and community services are a part of the SIWAB/SIKOMANDAN program. The purpose of the study was to assess the program performance through several aspects, such as the number of frozen semen distribution, the number of cow acceptors, the number of cow pregnancies, the service per conception rate, the number of calf’s birth, and the economic impact. Data collected by Directorate General of Livestock and Health (DGLH) was for five years. The Key Performance Indicators utilized to analyze the program performance. The incremental capital-output ratio (ICOR) model was used to determine the economic valuation. The results determine that the analysis of Key Performance Indicators (KPIs) for the SIWAB/SIKOMANDAN program shows that the performance category was good and excellent. The proves that the five aspects assessed by KPI’s analysis, namely frozen semen distribution, cow acceptors, cow pregnancy, S/C rate, and calf’s birth are in accordance with the targets set. Meanwhile, the economic impact arising from this program could increase economic value added and development efficiency, the ICOR value < 1.
Keywords | Artificial insemination, Frozen semen, Acceptor cow, Pregnancy cow, Economic impact
Received | February 08, 2023; Accepted | May 10, 2023; Published | May 29, 2023
*Correspondence | Achmad Firman, Department of Social Economic Livestock Development, Faculty of Animal Husbandry, Universitas Padjadjaran, Indonesia, Jl. Raya Bandung-Sumedang Km 21, Jatinangor, Sumedang 45363, West Java, Indonesia; Email: achmad.firman@unpad.ac.id
Citation | Firman A, Kuswaryan S, Nurlina L, Hadiana MH, Sulistyati M, Yunasaf U, Budinuryanto DC, Trisman I (2023). Valuation of massive artificial insemination programs and the economic impact for Indonesia. Adv. Anim. Vet. Sci. 11(7):1037-1046.
DOI | https://dx.doi.org/10.17582/journal.aavs/2023/11.7.1037.1046
ISSN (Online) | 2307-8316
Copyright: 2023 by the authors. Licensee ResearchersLinks Ltd, England, UK.
This article is an open access article distributed under the terms and conditions of the Creative Commons Attribution (CC BY) license (https://creativecommons.org/licenses/by/4.0/).
INTRODUCTION
Indonesia is a big country with a number human population of almost reach 270 million people (Central Bureau of Statistics, 2020). The challenge with densely populated countries is food preparation, especially animal protein supplies. Food supplies do not only focus on meeting calorie or carbohydrate requirements but also meeting animal protein needs (Anisa et al., 2017; Kim et al., 2019). Protein is essential for humans because it can build and repair muscles, bones, hormones, and enzymes (Rismayanthi, 2006). Therefore, it must be a protein component of every food consumption, like beef.
Beef has become an inseparable part of food consumption in Indonesia. Almost all Indonesian people have ever consumed beef, at least on Eid al-Adha. The development of beef consumption will continue to grow along with population growth. According to International Fund for Agriculture Development (IFAD, 2015), Estimated, the world’s population can reach 9 billion people in 2050, and food productivity of 50% to 70% is for food fulfillment. In addition, ruminants provide 26% of human protein consumption and 13% of total calories. It means that the consumption of ruminant livestock products, such as beef, is positively correlated with an increase in a number of human populations. According to FAO (2019), the challenges ahead are population growth that continues to increase and dietary changes can encourage food needs by up to 60 percent. Agricultural production and livelihoods will face the challenge of providing adequate food for the population and healthy food and be able to preserve a depleting natural resource base.
Directorate General of Livestock and Animal Health Services (DGLVS, 2020) reported that the total population of beef cattle in Indonesia has slightly increased since 2015 (Figure 1). The entire population is only 6.75% of the total human population in Indonesia. The number of human populations can reflect the amount of beef meat demand in Indonesia. The average beef meat demand is approximately 675.11 thousand tons per annum, while beef meat production is about 471.30 thousand tons per annum. The gap between beef meat demand and production reaches 203.81 (30.19%) thousand tons per annum. It determines that the rate of beef meat demand is higher than the beef meat supply (Firman et al., 2018; Ariningsih, 2014). Figure 2 illustrates that the beef meat demand has continued to increase from 2015-2022, however, beef production has decreased since the Covid-19 outbreak in 2020. It has created an imbalance in the supply and demand for beef which is quite large compared to before the occurrence of Covid-19.
Shortage of beef meat demand was imported by out of Indonesia, for instance Australia. The imports are in order to balance in and out of cattle in aggregate. To reduce the demand gap, the government implemented a breakthrough program to increase the cattle population in Indonesia. Therefore, the government has issued a national program of insemination to accelerate the increasing of cattle population through the implementation of massive artificial insemination at the end of 2016. The name of the program is SIWAB/SIKOMANDAN. The program has a set to produce the local cattle population by facilitating and optimizing massive artificial insemination, improving feed and nutrition, animal health, and information systems integration. Increasing cattle population is the main target of this program. Before the program, several government programs were setted to achieve the cattle population from 2005-2010, namely the beef self-sufficiency program, the partnership program, and the cow import program (Atmakusuma et al., 2015; Ashari et al., 2012). However, programs were not running well because there was no program integration with one management, no information system and reports that are connected from the local government to the center on a daily, weekly, or monthly basis (Atmakusuma et al., 2015; Ashari et al., 2012; Widiati, 2014).
The Ministry of Agriculture allocates a budget to support programs from the national to the district level. Traditionally, the government will be said to be successful if budget absorption is close to 100% (Hidayat, 2017; Klimaitienė et al., 2020). Currently, the government’s budget should be able to achieve the targets set, such as output, benefits, or outcomes that can be felt by the community (Hidayat, 2017). To ensure target achievement and monitoring activity, there are several models to measure the performance organization or institution, such as key performance indicators (KPIs), Balanced Scorecard (BSC), Integrated Performance Measurement System (IPMS), and Performa Prism (Simbolon, 2015). Balanced Scorecard (BSC), Integrated Performance Measurement System (IPMS), and Performa Prism have developed to measure the company’s performance from the financial and non-financial side (Simbolon, 2015), while the KPIs determine the key indicators that are the target of the organization (Klimaitienė et al., 2020). However, these models have in common to be used by organizations, government institutions, and companies according to their respective goals.
Key performance indicators (KPIs) are targets that help you measure improvement against your most strategic purposes. While institutions can have many types of metrics, KPIs are targets that are “key” to the success of your business. Based on the definitions exploring of KPI from various authors, word “key” of KPI is similar with the essential or most important criteria which objectives of enterprises or organizations (Klimaitienė et al., 2020). KPIs can be assessed and provide information on the extent to which the government and company strategic objectives have successfully achieved (Gusnadi and Hermawan, 2020; Adianto et al., 2014). In another persfective, KPIs support the management system to improve company performance in achievement of targets, such as labour, management, and financial (Ante et al., 2018; Zelga, 2018).
Various studies in the livestock sector have used the KPIs model to measure key indicators, both within and outside Indonesia, as shown in Table 1. According to Table 1, the KPIs model in the livestock sector is relatively limited in Indonesia compared to European and American countries. It means that in developed countries, used the KPIs model is often used to measure company performance, especially in monitoring and evaluation aspects.
The SIWAB/SIKOMANDAN program has aimed to increase the cattle population as the success the program through the number of frozen semen distribution, the number of cow acceptors, the number of cow pregnancies, service per conception rate, and the number of birth of calves. Unfortunately, the annual report submitted by the Directorate General for Livestock and Animal Health Services (DGLAHS) on the performance of the SIWAB/SIKOMANDAN program has not used the KPIs model to measure performance indicators and measure the economic impact of government investment on this program yet. Therefore, this study aimed to assess the program performance through the number of frozen semen distribution, the number of cow acceptors, the number of cow pregnancies, service per conception rate, the number of birth of calves, and the economic impact.
MATERIALS AND METHODS
Study area and colleting data
The research was held in Indonesia, and data collected by Directorate General of Livestock and Health (DGLH) was for five years from 2017 to 2021. DGLVS collected data from all provinces (34 provinces) to analyze the program’s achievements nationally. The data collected includes the number of frozen semen distribution, the number of the acceptor (productive cows), the number of cow pregnancies, service per conception value, and the number of birth calves. Previously, there had never been any data collection related to this matter. DGLVS has established a reporting system through the iSIKHNAS system from the district to the national level. Besides, it and can be monitored and controlled on a weekly, monthly, and yearly basis. iSIKHNAS system is an Indonesian animal health information system which compiles all reports on artificial insemination, pregnancy, calf births, and animal health reported by Livestock Services at the district/city, provincial to central government levels every day.
Table 1: Studies in the livestock sector using the KPIs model.
|
Author |
Research focus |
Location |
|
Purnami (2021) |
Milk supply chain performance at the Mojosongo Cooperative, Central Java Province |
Indonesia |
|
Rayesa (2018) |
Analyze the performance of dairy cooperatives in Yogyakarta |
Indonesia |
|
Kusmawan (2022) |
Performance measurement of layer husbandry Dafa farm banjaran |
Indonesia |
|
Hewit et al. (2018) |
Evaluation of key performance indicators to monitor performance in beef herds |
Nottingham |
|
Kelly et al. (2011) |
Identification of key performance indicators for on-farm animal welfare incidents: Possible tools for early warning and prevention |
Europe |
|
Armengol et al. (2022) |
Key performance indicators used by dairy consultants during the evaluation of reproductive performance in a first visit |
Europe, America, Asia, Africa, and Oceania |
|
Hansen (2005) |
Key Performance Indicators on Dairy Farms |
Norway |
Procedures and analysis
The research analysis used key performance indicators (KPIs) and incremental capital output ratio (ICOR). Valuation of the massive artificial insemination programs focused on performance indicators achievement. The aspects assessed were the number of frozen semen distribution, the number of cow acceptors, the number of cow pregnancies, the service per conception rate, and the number of birth of calves. The analysis used to assess these indicators was the key performance indicators (KPIs). The KPIs are financial and non-financial indicators that institution/organization/government uses to testify how the success organization in long-lasting aims (Velimirović et al., 2011; Febrinata et al., 2014). The KPIs are static and stable indicators that convey more meaning when comparing information, especially compared with the target and the realization of indicators (Velimirović et al., 2011; Hidayat, 2017). In addition, the KPIs help to focus on the job and object of the business, and get profit (Velimirović et al., 2011). The KPIs analysis used the following formulas:
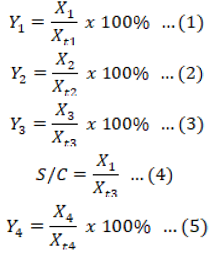
Where Y1 is the achievement of the number of frozen semen distribution (%), X1 is the realization of the number of the semen distribution in doses, and Xt1 is the target of semen distribution. Y1 is a determining factor for the success of frozen semen distribution. Y2 is the achievement of the number of acceptors (%), X2 is the realization of the number of acceptors (heads), and Xt2 is the target of acceptors. Y3 is the number of cow pregnancies, X3 is the realization of the number of cow pregnancies, and Xt3 is the target of cow pregnancy. Meanwhile, the formula of the S/C value was X1/Xt3 (in Equation 4). And Y4 is the achievement of the number of birth of calves, X4 is the realization of the number of birth of calves and Xt4 is the target of the birth of calves.
Table 2: The success measure of KPIs.
|
Indicators |
Performance categories |
|
Y ≥ 100% |
Excellent |
|
75% ≤ Y < 100% |
Good |
|
50% ≤ Y < 75% |
Sufficient |
|
25% ≤ Y < 50% |
Acceptable |
|
Y < 25% |
Fail |
Based on Rahardja et al. (2012), the success measure of KPIs can be seen in the Table 2. The Table 2 show that the aspect (Yn) reaches excellent performance if the aspect (Yn) achieves equal or more than 100 percent. In contrast, the aspect (Yn) get less than 25%, the performance is in fail performance. Yn means Y1 to Y4.
Meanwile, service per conception is the frequency of matting, both natural mating and artificial insemination, to produce pregnant cattle, or frequently used as a sign of fertility (Siatka et al., 2017). In this study, service perception was the frequency of matting measured by the artificial insemination services (doses) and used for mating acceptors. The optimal range of S/C values was under 1.6 in good category, between 1.6 and 1.8 in normal category, and S/C around 2 was acceptable, but S/C more than 3 indicates that it has reproductive problems (Siatka et al., 2017; Haryanto et al., 2015).
The economic valuation to measure the economic impact used the ICOR (Incremental Capital Output Ratio) analysis. The ICOR value shows the level of economic efficiency in using capital goods as a factor of production (Setiyanto, 2016). The formula used to calculate the ICOR value is as follows:

Where ∆Kt is the financial investment in year t and ∆Yt is the value-added output in year t. In this study, the Government supported the financial investment for the UPSUS SIWAB/SIKOMANDAN program. The added value output was the value of all birth of calves in a year. The ICOR value is lower than 1, which means that the investment is efficient (Setiyanto, 2016; Mahmud, 2008). ICOR value is more than 1 (ICOR > 1), which means that the investment is not efficient (Susilowati et al., 2012).
RESULTS AND DISCUSSION
Program SIWAB/SIKOMANDAN overview
The program beginned in 2017, namely SIWAB, but the name of the program changed to the SIKOMANDAN program in 2020. However, there is no significant change in the program system has been established since 2017. The goals are to increase the beef cattle population, especially at the small-scale farmer’s level. The typical smallholder livestock producers in Indonesia have one to five cows, limited land, semi-permanent pens, traditional management, family-based labor, taking various economic activities, and inadequate money and assets to raise cattle (Asmara et al., 2017; Daud et al., 2015; Rapsomanikis, 2015). Small-scale farmers dominate the cattle farming business in Indonesia (Hastang and Asnawi, 2014). Beef cattle play an important role in the daily life of smallholder farmers, i.e., to generate cash income, savings, and a very liquid asset; to develop social relationships, such as for a signal social status; to fulfill the nutritional need, and to be for religious purposes, such as sacrificial animals on Eid al Adha for Muslim countries, or as symbols for Hinduism in India country (Firman and Obed, 2021; Doğan et al., 2013; Uba et al., 2015; Moyo and Mlilo, 2019; Winarso, 2014; Tuncel and Cevger, 2015; Kennedy et al., 2018).
The Government of Indonesia defrayed funds for the program from 2017 to 2021. The budget was used to support improved feed quality, massive artificial insemination services, purchasing and distribution of frozen semen, purchasing and distribution of liquid nitrogen, animal health services, veterinary public health services, pregnancy examination, and birth management, and monitoring and reporting systems (Figure 3).
Beef cattle farms require new approach, such as sustainable, modern, and professional, to increase utilizing technological innovations to improve business efficiency (Mayulu and Sutrisno, 2014). The approach will face constrains because the business actors are dominated by small-scale farmers who have limited cattle, capital, land, traditional management, family labour, and limited funds to operate farms. The number of smallholder cattle farmers in Indonesia was 5 million farmers with 2-3 heads ownership (Rusdiana and Praharani, 2019). Family cattle farm contribute to the beef cattle population in Indonesia and contributes 6.8% of the total income of livestock farmers (Harsita and Amam, 2019). Raising cattle is a side source of family income. Therefore, the most farmers pay more attention to their main livelihood (as rice/horticulture farmers). Hence, this program can assist farmers to increase the cattle population on the farm.
Program performance
The main objective of the program is to increase the beef cattle population in Indonesia. It is needed to reduce the gap between the demand and supply of beef in Indonesia. To analyze the program performance, a comparison of targets and realization of each indicator, such as the distribution of frozen semen, cow acceptors, cow pregnancy, service perceptions, and the birth of calves, is used as program performance.
Frozen semen distribution
Frozen semen is a method of preserving sperms in the straw through the freezing system and stored in liquid nitrogen at a temperature of -196oC in cryogenic containers (Indonesian National Standard (SNI) No. 4869-1:2017, 2017). The frozen semen used in this program is the frozen semen of cattle from various breeds, such as local cattle and others. Figure 4 illustrates the target and realization of the semen distribution. The frozen semen distribution means the amount of frozen semen used for insemination services. Based on research data, the target of the distribution of frozen semen from 2017-2021 was above three million doses. In 2017, the semen distribution target was four million doses, and the highest was 5, 5 million doses in 2021 compared to 2017–2020. However, the achievement of the frozen semen distribution in 2017 was lower compared to the distribution achievement from 2018 to 2021 because the program was socialized in November 2016 by the Minister of Agriculture, then started in January 2017. Therefore, some activities have not been prepared properly at that time.
The number of cow acceptors
Cow acceptors are cows that will be artificially inseminated and have met the requirements, such as reproductive health (Yohana et al., 2018). Figure 5 is the target and realization of the number of cow acceptors. The cow acceptors established the potential of productive cows from all provinces and the stipulated budget. Based on Figure 4, the target of acceptors was between 3 million to 4 million heads. The result showed the achievement of cow acceptors exceeded the set target.
According to the data from DGLAHS (2022), 26 provinces have achieved more than the target number of cow acceptors receiving insemination services, especially East Java, Central Java, Yogyakarta, and Lampung. The regions had a target of acceptor cattle between 100,000 to 1,300,000 heads compared to others. However, six regions only reached less than 100%.
Number of cow pregnancy
In this context, productive cow acceptors should be a positive response to the services provided in the program because they have received reproductive health checks and feed assistance to improve the body condition of the female cow. The positive response that emerged from artificial insemination services was pregnancy. The pregnancy rate can indicate the success rate of marriage, either artificially or naturally. However, the incidences of non-cow pregnancy at the farmer level are reproductive disorders. Reported several occurrences that often occur due to reproductive disorders are ovarian hypofunction, repeat breeding, silent heat, corpus luteum persistent, delayed puberty, cystic ovaries, abnormal uterus, luteal cyst, follicular cyst, endometritis, atrophy, delayed puberty, vaginal inflammation, retained placenta, dystocia, and hypoplasia (Ratnani et al., 2020; Sutiyono et al., 2017; DGLAHS, 2020). Generally, reproductive disorders were ovarian hypo-function at 41.18% and endometritis at 11.16%. DGLVS also reported that the examination for reproductive disorders in January-December 2019 found 61,859 heads (91.263%). The number of cows that recovered from reproductive disorders reached 45,615 cows (73.74%), and 26,036 (57.08%) heads have artificially inseminated, and 8,561 (32.88%) cows got pregnant. The problems often arise in small-scale farms because the farmers cannot recognize the symptoms and signs of lust in cows. The intensity of lust is less apparent, it ultimately results in artificial insemination being less precise and pregnancy failure (Anisa et al., 2017).
Figure 6 shows the target and realization of cow pregnancy in four years. The general picture shows that the average number of cows had pregnant was 87.84%. The number of pregnant cows increased in 2017-2021, while the realization exceeded the target in 2019. It indicates that it is a positive signal to be a potential for calves to be born from several pregnant cows and a positive signal to born many calves. The program’s success is still very early in closing the faucet on imported cattle. An increasing number of pregnant cows was due to the government conducting an estrus synchronization activity in several regions. Estrus synchronization was determined to triggers simultaneous estrus in a herd of cows (Hermadi, 2015). According to DGLAHS (2020), 25 provinces achieve a success rate of cow pregnancy above 100% from the results of artificial insemination. Two regions can reach more than 180%, namely Maluku (187.43%) and North Maluku (181.71%). Many factors influence to successful cows’ pregnancy, one of which is the ideal body condition of the cow (BCS > 2) and the timeliness of artificial insemination with estrus (Anisa et al., 2017; Yakubu et al., 2013). According to Mansur (2021), the BCS score consists of 1-5 based on Canadian categories, such as BCS= 1: very thin, BCS= 2: thin, BCS= 3: moderate, BCS= 4: fat, and BCS= 5: very fat.
Service per conception
Figures 4 and 6 represented a measure of the service per conception (S/C). Table 3 shows that the average S/C value was 1.82, which means it required twice the services for a productive cow to get pregnant. The value of 1.82 was in the normal range (Siatka et al., 2017; Ghiasi et al., 2016). In the context of insemination, 1.82 determines that it needs two straws of frozen semen for services, time and energy consumption, long calving intervals, and additional operational costs.
Several factors that most influence the high S/C rate, such as delays in detecting estrus and body condition score (BCS) values below 3 (Anisa et al., 2017). Lack of feed, both in quality and quantity, reinforced the problems of livestock reproduction at the farm level (Saili et al., 2016; Hermadi, 2015). This condition often occurs in the dry season because of a lack of forage. Cows often feed with rice straw without being given additional feed. Energy reserves were closely related to nutrition where nutrition and nutritional status of cattle could affect the intensity of lust because it is associated with reproductive hormones (Winugroho, 2000).
Table 3: The performamce indicator of service per conception.
|
Years |
Insemination services (doses) |
Cow pregnancy (head) |
S/C rate |
|
2017 |
3976470 |
1892462 |
2.10 |
|
2018 |
3987661 |
2051108 |
1.94 |
|
2019 |
3586374 |
2334474 |
1.54 |
|
2020 |
3545199 |
1891426 |
1.87 |
|
2021 |
3791140 |
2295346 |
1.65 |
|
Average |
1.82 |
The number of calves born
The number of birth of calves is the number of cows that have successfully given birth. Calves had an economic value for farmers because the calves are a liquid asset (Hastuti et al., 2008; Prasetyo et al., 2020). The proceeds from the sale of calves can contribute to the farmer’s income from 32% to 54% (Rahayu et al., 2014; Michaličková et al., 2015). Therefore, the number of birth of calves indicates an increasing cattle population nationally. Based on Figure 7, the number of birth of calves continued to increase from 2017 to 2021. The number of birth of calves from 2017 to 2021 was more than 9.23 million heads. It can prove that the SIWAB/SIKOMANDAN program can provide additional cattle population and provide a balance for domestic cattle slaughter. The success of the number of birth of calves was inseparable from the role of field officers, such as insemination officers, veterinary officers, extension agents, and local government. DGLAHS reported that 28 provinces achieved calf birth rates of more than 100% of the target, and Banten and Kepulauan Riau provinces achieved a birth rate of more than 200%.
Based on the description above, the program performance can be seen in Table 4. The achievements of each aspect of the program show an average result between 89% - 127%. It means that the program performance category ranges from good to very good. The performance category for S/C is under normal conditions. Therefore, the overall performance can be said to be good and excellent.
Economic valuation
Economic valuation is a measuring instrument to determine the effect of government investment. Economic valuation means the economic change in income or expenditure generated in an area due to investment (Warnick and Bojanic, 2012). ICOR analysis is a measuring tool for calculating the economic valuation. Table 5 shows that the investment spent by the government for the program was able to produce an ICOR value < 1 and a very efficient investment (Susilowati, 2012). It can prove that the program could increase the number of cattle in Indonesia with an additional close to 2 million heads per year. The government expenditure for this program was US$ 388.12 million for five years. The added value was able to generate US$ 2.83 billion. This economic value-added was obtained from the number of birth of calves each year and multiplied by the value of calf sales equal to US$ 310.35 per head.
Table 4: Key performance indicators.
|
Aspects |
Years |
Average |
Performance category |
||||
|
2017 |
2018 |
2019 |
2020 |
2021 |
|||
|
Frozen semen distribution (%) |
88.89 |
145.01 |
146.41 |
154.95 |
99.52 |
126.96 |
Excellent |
|
Cow acceptors (%) |
99.41 |
132.9 |
119.5 |
118.2 |
94.78 |
112.96 |
Excellent |
|
Cow pregnancy (%) |
63.08 |
97.67 |
111.17 |
90.07 |
84.57 |
89.31 |
Good |
|
S/C rate |
2.10 |
1.94 |
1.54 |
1.87 |
1.65 |
1.82 |
Normal |
|
Birth of calves (%) |
45.56 |
109.09 |
118.78 |
136.95 |
91.61 |
100.40 |
Excellent |
Table 5: The economic impact on the program.
|
Years |
Govern investment |
Value added |
ICOR |
|
US$ |
US$ |
||
|
2017 |
75,862,069 |
230,936,276 |
0.33 |
|
2018 |
82,758,621 |
568,789,759 |
0.15 |
|
2019 |
82,758,621 |
619,301,793 |
0.13 |
|
2020 |
76,972,323 |
714,031,556 |
0.11 |
|
2021 |
69.766.381 |
694.528.230 |
0,10 |
|
Total |
388.118.015 |
2.827.587.614 |
0.14 |
Overall, the Government of Indonesia has made a breakthrough increasing the cattle population in Indonesia. The program could reduce inequality in the demand and supply of beef. The program is very effective and efficient in proving the achievement of program performance and the economic value. In addition, the integration of reproduction, animal health, feed, veterinary public health, and information system could make programs more transparent and accountable. The program is carried out simultaneously by the central government to regional governments with coordinated directly by the Ministry of Agriculture. An integrated reporting system was the mainstay of the program to monitor and evaluate obstacles that occur in the field.
However, there are still some obstacles that have not been able to overcome by the program, such as the delay in farmers reporting the presence of estrus in their cows, data on the performance conditions of cow acceptors (BCS values), evaluation of the quality of frozen semen, service quality evaluation of inseminators, and tracking of calves that are born. The calve tracking is needed to get some information about calves that are born can be collected, such as how many male and female calves, how many calves died or slaughtered, and how many calves grow into heifers. Program improvements should focus on early detection of estrus by farmers, improving semen quality, and tracking systems for calf births. However, the SIWAB/SIKOMANDAN program can produce program effectiveness because it can achieve and or exceed the set targets.
CONCLUSIONs and Recommendations
Based on the description above, the analysis of Key Performance Indicators (KPIs) for the SIWAB/SIKOMANDAN program was between good and excellent performance. Five aspects assessed, namely frozen semen distribution (excellent), Cow acceptors (excellent), Cow pregnancy (good), S/C rate (normal), and Birth of calves (excellent). Meanwhile, the economic impact arising from this program could increase economic value added as well as development efficiency, the ICOR value < 1.
ACKNOWLEDGMENT
I thank the Directorate General Livestock and Health, Ministry of Agriculture for its valuable help in supporting data.
Novelty Statement
This study is the first study using KPIs and ICOR to measure the performance of the SIWAB/SIKOMANDAN program.
AUTHOR’S CONTRIBUTION
The manuscript has been compiled and written by author and co-authors. Achmad Firman as author has contributed to the writing framework, writing, and Key Performance Indicators analysis, Sondi Kuswaryan as co-author has contributed to the ICOR analysis and writing, Lilis Nurlina as co-author has contributed to the data compilation and writing, Muhamad Hasan Hadiana as co-author has contributed to the data compilation and writing, Marina Sulistyati as co-author has contributed to writing, Unang Yunasaf as co-author has contributed to writing, and Iman Trisman as co-author has contributed to the data compilation.
Conflict of interest
The manuscript was written by the team and there is no conflict of interest with any party related to the materials discussed in the paper.
REFERENCES
Adianto, Saryatmo MA, Gunawan AS (2014). Company performance measurement analysis with performance prism and scoring objective methods matrix (OMAX) at PT. BPAS. Sinergi, 18(2): 61-70.
Anisa E, Ondho YS, Samsudewa D (2017). The influence of different body condition score (BCS) on the on the intensity of estrous on simmental peranakan ongole cattle (simpo). J. Sain Peternakan Indonesia, 12: 133–141. https://doi.org/10.31186/jspi.id.12.2.133-141
Ante G, Facchini F, Mossa G, Digiesi S (2018). Developing a key performance indicators tree for lean and smart production system. IFAC-Papers Online, 51(11): 13-18. https://doi.org/10.1016/j.ifacol.2018.08.227
Ariningsih E (2014). Performance of national beef self-sufficiency policy. Forum Penelitian Agro Ekonomi, 32: 137-156. https://doi.org/10.21082/fae.v32n2.2014.137-156
Armengol R, Fraile L, Bach A (2022). Key performance indicators used by dairy consultants during the evaluation of reproductive performance in a first visit. Front. Vet. Sci., 9: 871079. https://doi.org/10.3389/fvets.2022.871079
Ashari, Ilham N, Nuryanti S (2012). Beef self-sufficiency program dynamics: Revisiting its concept and implementation. J. Analisis Kebijakan Pertanian, 10(2): 181-198. https://doi.org/10.21082/akp.v10n2.2012.181-198
Asmara A, Purnamadewi YL, Lubis D (2017). The relationship analysis between service performance of Milk Producer Cooperative with the dairy farm performance of members. Media Peternakan, 40: 143–150. https://doi.org/10.5398/medpet.2017.40.2.143
Atmakusuma J, Harmini, Winandi R (2015). Is it possible to achieve self-sufficiency in meat? J. Risalah Kajian Strategis Bidang Pertanian Dan Lingkungan, 1(2): 105-109. https://journal.ipb.ac.id/index.php/jkebijakan/article/view/10301
Central Bureau of Statistics (2020). Trends of selected socio-economic indicators of Indonesia November 2021. Central Bureau of Statistics, Indonesia
Daud AR, Putro US, Basri, MH (2015). Risks in milk supply chain; a preliminary analysis on smallholder dairy production. J. Livest. Res. Rural Dev., 27: 1-10. http://www.lrrd.org/lrrd27/7/daud27137.htm
Directorate General for Livestock and Animal Health Services (DGLAHS) (2020). Livestock and animal health statistics 2020. Directorate General Livestock and Health, Indonesia Ministry of Agriculture, Indonesia
Directorate General for Livestock and Animal Health Services (DGLAHS) (2022). Livestock and animal health statistics 2022. Directorate General Livestock and Health, Indonesia Ministry of Agriculture, Indonesia
Doğan Z, Arslan S, Köksal AG (2013). Historical development of agricultural accounting and difficulties encountered in the implementation of agricultural accounting. Int. J. Food Agric. Econ., 2: 107-116.
Febrinata, Budijanto M, Iftadi I (2014). Key performance indicators (KPI) design using the balanced scorecard method at PT. Aston Syst. Indonesia Performa, 13(1): 1-6.
Firman A, Nono OH (2021). A social-ecological system approach to Bali cattle raising in Timor Island, Indonesia. Biodiversitas, 22: 3585-3593. https://doi.org/10.13057/biodiv/d220860
Firman A, Sulaeman MM, Herlina L, Sulistyati M (2018). Analysis of balance supply and demand of cattle and beef cattle in West Java. J. Mimbar Agribisnis, 4: 98-108. https://doi.org/10.25157/ma.v4i2.1122
Food Agriculture Organization (FAO). 2019. FAO’s work on family farming preparing for the decade of family farming (2019–2028) to achieve the sdgs. Food Agriculture Organization. Rome.
Gayatri S, Vaarst M (2020). Indonesian smallholder beef producers’ perception of sustainability and their reactions to the results of an assessment using the sustainability assessment of food and agriculture system (SAFA) - a case study based on focus group discussions. J. Indonesia Trop. Anim. Agric., 45: 58-68. https://doi.org/10.14710/jitaa.45.1.58-68
Ghiasi H, Piwczyński D, Khaldari M, Kolenda M (2016). Application of classification trees in determining the impact of phenotypic factors on conception to first service in Holstein cattle. J. Anim. Prod. Sci., 56: 1061–1069. https://doi.org/10.1071/AN13541
Gusnadi Y, Hermawan A (2020). Designing employee performance monitoring dashboard using key performance indicator (KPI). Bit-Tech, 2(2): 19-26. https://doi.org/10.32877/bt.v2i2.107
Hansen BG, Stokstad G, Hegrenes A, Sehested E, Larsen S (2005). Key performance indicators on dairy farms. J. Int. Farm Manag., 3(1): 1-13.
Harsita PA, Amam (2019). The main problems of beef cattle farming business at the farmers level by approach of vilfredo pareto analysis. Prosiding Seminar Nasional Teknologi Peternakan dan Veteriner. pp. 254–262.
Haryanto D, Hartono M, Surharyati S (2015). Some factors influences service per conception of Bali cattles in pringsewu regency. J. Ilmiah Peternakan Terpadu., 3: 145–150.
Hastang, Asnawi A (2014). Profit analysis of cattle farms based on rural farm in Bone regency. J. Ilmiah Ilmu-Ilmu Peternakan, 1: 240–252.
Hastuti D, Nurtini S, Widiat R (2008). Socio-economic study of the implementation of artificial insemination of beef cattle in Kebumen Regency. J. Mediagro. 4: 1–12.
Hermadi HA (2015). Eradication of cases of mastery in livestock towards independence in the field of reproductive health and food security in Indonesia. April. Master thesis. Universitas Airlangga, Surabaya.
Hewit S, Green M, Hudson C (2018). Evaluation of key performance indicators to monitor performance in beef herds. Livestock, 23(2): ISSN (online): 2053-0870. https://doi.org/10.12968/live.2018.23.2.72
Hidayat S (2017). Determination of key performance indicator with balanced score card approach in public sector. J. Appl. Manag., 15(2): 290-300. https://doi.org/10.21776/ub.jam.2017.015.02.13
International Fund for Agriculture Development (IFAD). (2015). Small holders livestock development. International Fund for Agriculture Development, Rome. pp. 1-7.
Kelly PC, More SJ, Blake M, Hanlon AJ (2011). Identification of key performance indicators for on-farm animal welfare incidents: Possible tools for early warning and prevention. Irish Vet. J., 64(13): 2-9. https://doi.org/10.1186/2046-0481-64-13
Kennedy U, Sharma A, Phillips CJ (2018). The sheltering of unwanted cattle, experiences in India and implications for cattle industries elsewhere. Animals, 8: 1-8. https://doi.org/10.3390/ani8050064
Kim SW, Less JF, Wang L, Yan T, Kiron V, Kaushik SJ, Lei XG (2019). Meeting Global Feed Protein Demand: Challenge, Opportunity, and Strategy. Ann. Rev., 7: 17.1–17.23. https://doi.org/10.1146/annurev-animal-030117-014838
Klimaitienė R, Derengovska E, Rudžionienė K (2020). Application of key performance indicators to improve the efficiency of monitoring of the organisation’s activities: Theoretical approach. Publ. Secur. Publ. Order Res. J., 25(2020): 218-233.
Kusnawan SP (2022). Performance measurement of layer husbandry using dafa farm Banjaran balanced scorecard method. Thesis, Universitas Pasundan. Indonesia
Mahmud M (2008). Incremental capital output ratio: A barometer of the efficiency of the national economy. J. Ilmiah Ekonomi Bisnis. 13: 27-37. https://ejournal.gunadarma.ac.id/index.php/ekbis/article/view/319
Mansur M (2021). Effect of body condition score on reproductive efficiency of dairy cows with reproductive disorders. J. Sains Teknologi Industri Peternakan. 1: 15-17. https://doi.org/10.51817/jstip.v1i1.254
Mayulu H, Sutrisno CI (2014). Beef cattle farming development policy in Indonesia. J. Agric. Res. Dev., 29: 34-41.
Michaličková M, Krupová Z, Krupa E (2015). Economic evaluation of cow-calf herds I. Calculation methods. Anim. Sci. Pap. Rep., 33: 257-266. https://www.igbzpan.pl/uploaded/FSiBundleContentBlockBundleEntityTranslatableBlockTranslatableFilesElement/ filePath/97/str257-266.pdf
Moyo VP, Mlilo P (2019). Contemporary socio-economic determinants of cattle ownership by farmers living at the edge of protected areas: A case of Hwange Rural Ward Fifteen, Zimbabwe. Int. J. Hum. Soc. Stud., 7: 247-254. https://doi.org/10.24940/theijhss/2019/v7/i6/HS1906-041
Prasetyo E, Ekowati T, Gayatri S (2020). An income analysis of beef cattle fattening system and its contribution to the total household income in Central Java Province. J. Indonesia Trop. Anim. Agric., 45: 365-372. https://doi.org/10.14710/jitaa.45.4.365-372
Purnami KR (2021). Supply chain performance measurement using scor model to improve competitiveness. Thesis, Universitas Muhammadiyah Surakarta. Indonesia
Rahardja U, Yusup M, Rosyifa E (2012). Optimization of key performance indicators (KPI) through approach balance scorecard efforts to implement performance management system (pms) in higher education. CCIT J., 6(1): 17-34. https://doi.org/10.33050/ccit.v6i1.373
Rahayu RS, Roessali W, Setiadi A, Mukson (2014). Contribution of dairy cattle business to farmer family income in Getasan District, Semarang Regency. J. Agriekonomika. 3: 45–54. https://journal.trunojoyo.ac.id/agriekonomika/article/view/439
Rapsomanikis G (2015). The economic lives of smallholder farmers. Food and Agriculture Organization of the United Nations, Rome. pp. 1-39.
Ratnani H, Dewa KM, Imam M (2020). Reproductive disorder treatments for reproduction efficiency improvements in dairy cattle to achieve milk self-sufficiency at Sendang district Tulungagung. J. Publ. Ser., 4: 43-52.
Rayesa NF (2018). Dairy cooperation performance analysis with balancedscorecard (BSC) approach. J. Ekonomi Pertanian Agribisnis, 2(2): 138-146.
Rismayanthi C (2006). Protein consumption for reaching achievement. J. Medikora, 2: 135-145.
Rusdiana S, Praharani L (2019). Development of people’s livestock: Swat private vocational policy and feasibility of animal businesses. Forum Penelitian Agro Ekonomi., 36: 97–116. https://doi.org/10.21082/fae.v36n2.2018.97-116
Saili T, Baa LO, Ode L, Sani A, Rahadi S, Sura IW (2016). Oestrus syncronization and artificial insemination using sexing semen from Bali’s cattle with different management system. J. Ilmu Ternak, 16: 49–55.
Setiyanto A (2016). ICOR of agriculture sector as a base direction of regency/municipality agriculture development in Indonesia. J. Analisis Kebijakan Pertanian, 13: 75-108. https://doi.org/10.21082/akp.v13n1.2015.75-108
Siatka K, Sawa A, Krezel CS, Piwczynski D, Bogucki M (2017). Effect of some factors on number of services per conception in dairy cows. J. Vet. Sci. Tech., 8: 8–11. https://doi.org/10.4172/2157-7579.1000465
Simbolon F (2015). Comparison of measurement systems company performance. Binus Bus. Rev., 6(1): 91-100. https://doi.org/10.21512/bbr.v6i1.991
Susilowati SH, Prajogo UH, Supena F, Muchjidin R, Mohamad M, Miftahul A (2012). Estimation of incremental capital output ratio (ICOR) for investment planning in the agricultural sector development framework. J. Agro Ekonomi., 30: 159-182. https://doi.org/10.21082/jae.v30n2.2012.159-182
Sutiyono, Samsudewa D, Suryawijaya A (2017). Identification of reproductive disorders in female cattle at local farms. J. Vet., 18: 580-588. https://doi.org/10.19087/jveteriner.2017.18.4.580
Tuncel S, Cevger Y (2015). The impact of Eid al-Adha (feast of the sacrifice) sales on the income of cattle fattening enterprises. J. Adv. Agric., 4: 492-498. https://doi.org/10.24297/jaa.v4i3.4282
Uba KD, Tiro M, Makandolu SM (2015). Profitability analysis of beef cattle business in district of Amarasi regency of Kupang. Jurnal Nukleus Peternakan 2: 170-178.
Velimirovića D, Velimirovićb M, Stankovića R (2011). Role and importance of key performance indicators measurement. Serbian J. Manag., 6(1): 63-72. https://doi.org/10.5937/sjm1101063V
Warnick RB, Bojanic DA (2012). Economic impact and significance: Additional insights for measurement in special events. Proceedings of the 2012 Northeastern Recreation Research Symposium. pp. 1–8.
Widiati R (2014). Build a cattle breeding industry cut the people in favor of adequacy beef. J. Wartazoa, 24(4): 191-200. https://doi.org/10.14334/wartazoa.v24i4.1090
Winarso B (2014). The role of marine transportation in improving livestock distribution from producers to consumers region. J. Appl. Agric. Res., 14: 83-96.
Winugroho M (2000). Supplementary feeding strategies to improve the reproductive efficiency of cows. J. Litbang Pertanian., 21: 19–23. http://203.190.36.42/publikasi/p3211023.pdf
Yakubu A, Fakuade OF, Faith EA, Azara MIS, Ogunwole OA (2013). Determination of prediction equations to estimate body condition score from body size and testicular traits of Yankasa rams. J. Indonesia Trop. Anim. Agric., 38: 79-85. https://doi.org/10.14710/jitaa.38.2.79-85
Yohana N, Samik A, Aksono EB, Sarjito T, Hermadi HA, Restiadi TI (2018). Conception rate and service per conception of dairy cattle acceptor artificial insemination in KUD Argopuro Krucil district Probolinggo region. Ovozoa, 7(2): 143-147. https://doi.org/10.20473/ovz.v7i2.2018.143-147
Zelga K (2018). Key performance indicators as a type of performance measurement analysis of a Chosen Enterprise. Acta Univ. Nicolai Copernici, 45(1): 127-135. https://doi.org/10.12775/AUNC_ZARZ.2018.011
To share on other social networks, click on any share button. What are these?

