
The Role of Pioglitazone Against Ehrlich Solid Carcinoma Mice Model Through Antiproliferative and Antiangiogenic Pathways


The Role of Pioglitazone Against Ehrlich Solid Carcinoma Mice Model Through Antiproliferative and Antiangiogenic Pathways
Dalia Zaafar1*, Heba M.A Khalil2, Soha Hassanin3, Mohamed R. Mousa4, Mona G. Khalil1

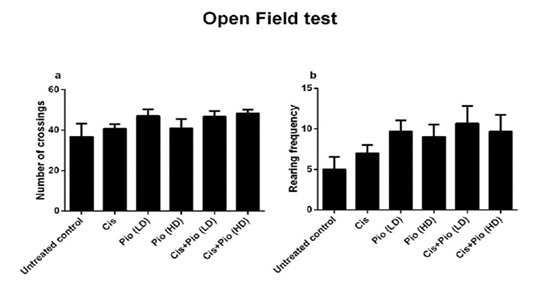
Effect of pioglitazone on the locomotor activity of ESC-bearing mice in the open field test. a. Number of crossings, and b. Rearing frequency. Data are expressed as mean ± standard deviation (SD), (one-way analysis of variance (one-way ANOVA).
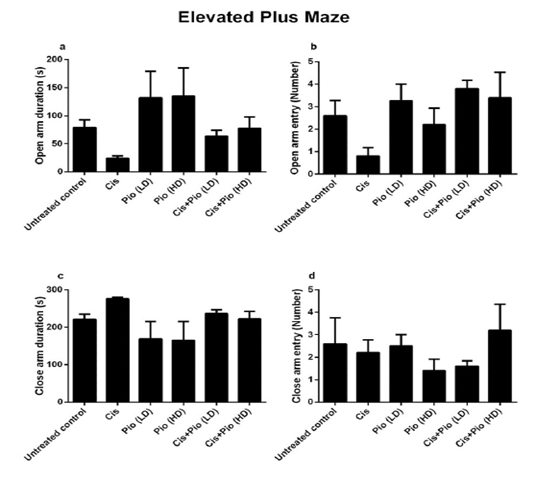
Effect of pioglitazone on the anxiety-like behavior of ESC-bearing mice in the elevated plus maze. a. Open arm duration, b. Open arm entry, c. Close arm duration, and d. Close arm entry. Data are expressed as mean ± standard deviation (SD), (one-way ANOVA), p<0.05
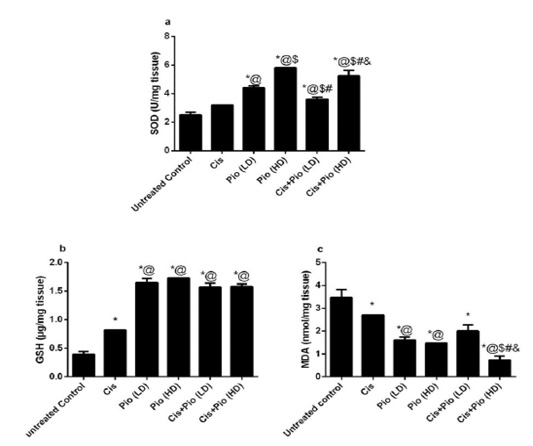
Effect of pioglitazone on the redox status of ESC-bearing mice. a. Superoxide dismutase (SOD), and b. Reduced glutathione (GSH), and c. Malondialdehyde (MDA). Data are expressed as mean ± SD, one-way ANOVA followed by post hoc test Bonferroni test for ten mice in each group. * Significant from the untreated control group, @ Significant from the cisplatin group, $ Significant from the Pio (LD) group, # Significant from the Pio (HD) group, & Significant from the Cis+ Pio (LD) group, p<0.05.
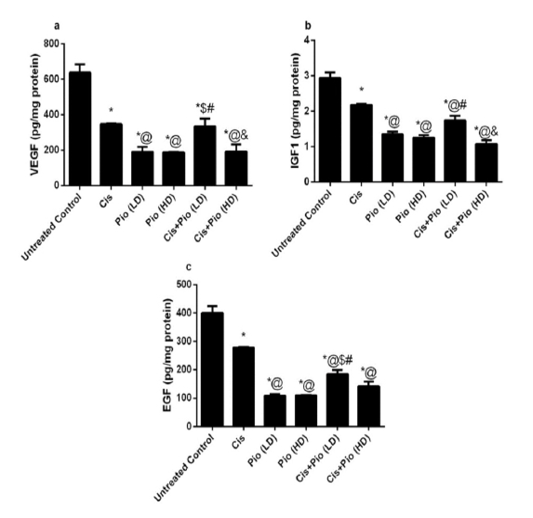
Effect of pioglitazone on the growth factors of ESC-bearing mice. a.Vascular endothelial growth factor (VEGF), and b. Insulin-like growth factor 1 (IGF1), and c. Epidermal growth factor (EGF). Data are expressed as mean ± SD, one-way ANOVA followed by post hoc test Bonferroni test for ten mice in each group. * Significant from the untreated control group, @ Significant from the cisplatin group, $ Significant from the Pio (LD) group, # Significant from the Pio (HD) group, & Significant from the Cis+ Pio (LD) group, p<0.05.
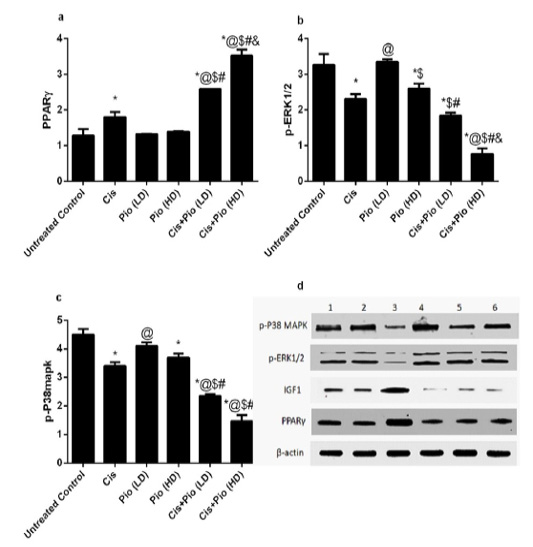
Effect of pioglitazone on the proliferation markers of ESC-bearing mice. a. Proliferating cell nuclear antigen (PPAR-γ), and b. Extracellular signal-regulated kinase (p-ERK ½), and c. p38 mitogen-activated protein kinase (p-38mapk). Data are expressed as mean ± SD, one-way ANOVA followed by post hoc test Bonferroni test for ten mice in each group. * Significant from the untreated control group, @ Significant from the cisplatin group, $ Significant from the Pio (LD) group, # Significant from the Pio (HD) group, & Significant from the Cis+ Pio (LD) group, p<0.05.
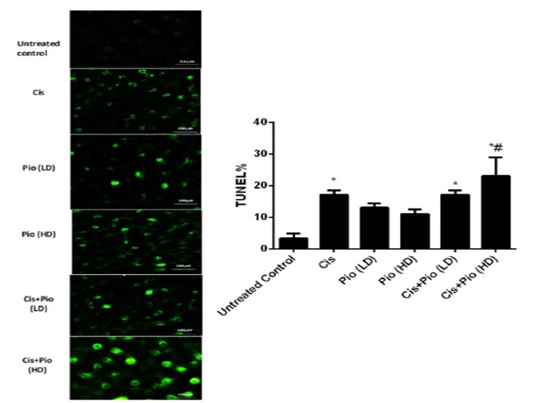
Effect of pioglitazone on the apoptotic activity of ESC-bearing mice using TUNEL assay Data are expressed as mean ± SD, one-way ANOVA followed by post hoc test Bonferroni test for ten mice in each group. * Significant from the untreated control group, and # Significant from the Pio (HD) group, p<0.05.

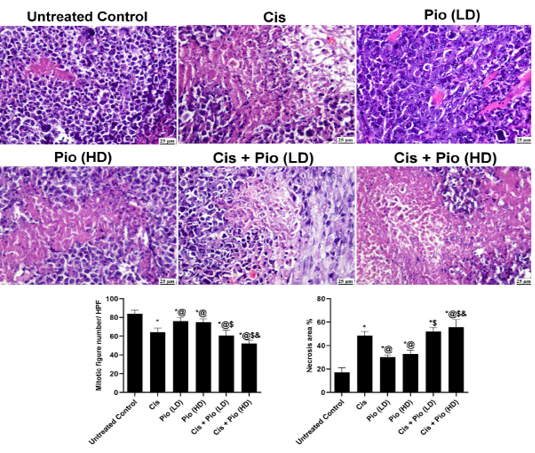
Histological sections stained with H&E showing the examined tumor mass in different groups.. The column charts illustrating the average of mitotic figure number/10 HPF and the necrosis area % in different groups. Data are expressed as mean ± SD, one-way ANOVA followed by post hoc test Bonferroni. * Significant from the untreated control group, @ Significant from the cisplatin group, $ Significant from the Pio (LD) group, and & Significant from the Cis+ Pio (LD) group, p<0.05.

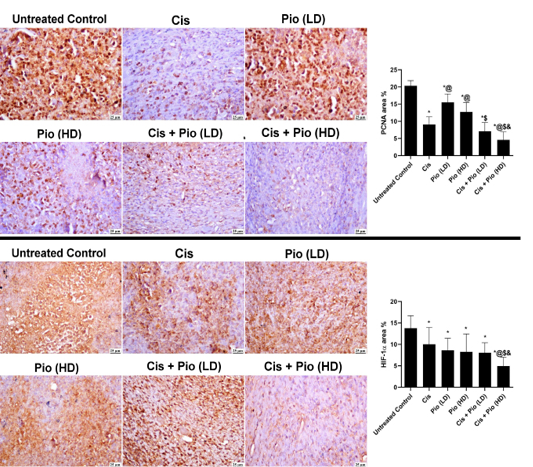
Histological sections immune stained with PCNA and hypoxia-inducible factor 1-alpha (HIF-1α) from solid tumor masses in different groups. Data are expressed as mean ± SD, one-way ANOVA followed by post hoc test Bonferroni. * Significant from the untreated control group, @ Significant from the cisplatin group, $ Significant from the Pio (LD) group, and & Significant from the Cis+ Pio (LD) group, p<0.05.
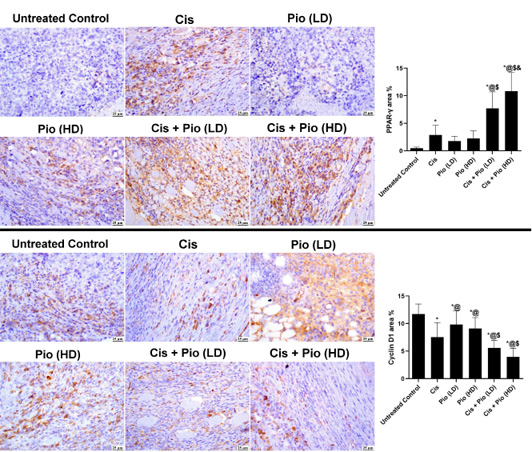
Histological sections immune stained with PPAR-γ and Cyclin D1 from solid tumor masses in different groups. Data are expressed as mean ± SD, one-way ANOVA followed by post hoc test Bonferroni. * Significant from the untreated control group, @ Significant from the cisplatin group, $ Significant from the Pio (LD) group, and & Significant from the Cis+ Pio (LD) group, p<0.05.

