
The Oxidative Stress-Mediated Effects in Pregnant Mice with Plasmodium berghei Infection


The Oxidative Stress-Mediated Effects in Pregnant Mice with Plasmodium berghei Infection
Syukriah Syukriah1, Ulinnuha Nur Faizah2, Hendry T.S. Saragih3*, Rizki Fitrawan Yuneldi4, Soenarwan Hery Poerwanto5, Raden Roro Upiek Ngesti Wibawaning Astuti5, Stephan Immenschuh6
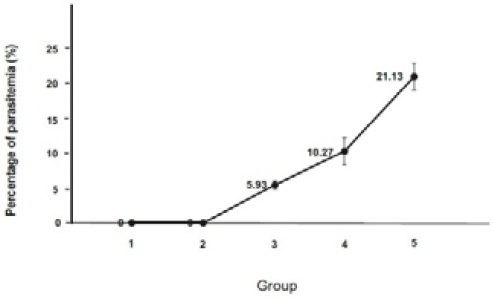
Level of parasitemia in mother. Group 1: non-pregnant; Group 2: pregnant (Offspring 1); Group 3: pregnant-infected was injected with dose 1 (Offspring 2); Group 4: pregnant-infected was injected with dose 2 (Offspring 3); Group 5: pregnant-infected was injected with dose 3 (Offspring 4).
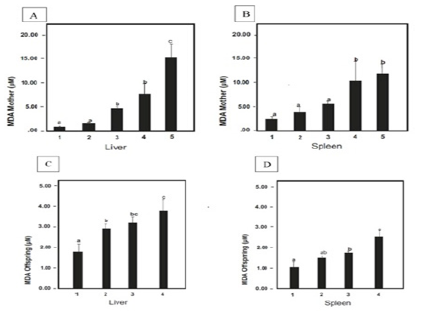
MDA levels of liver and spleen in mothers (A, B) and offspring (C, D). The MDA level in the maternal liver differs between the control group and the treatment groups infected with P. berghei. Group 1: non-pregnant; Group 2: pregnant (Offspring 1); Group 3: pregnant-infected was injected with dose 1 (Offspring 2); Group 4: pregnant-infected was injected with dose 2 (Offspring 3); Group 5: pregnant-infected was injected with dose 3 (Offspring 4). Different letters above the bars indicate a significant difference (p<0.05).

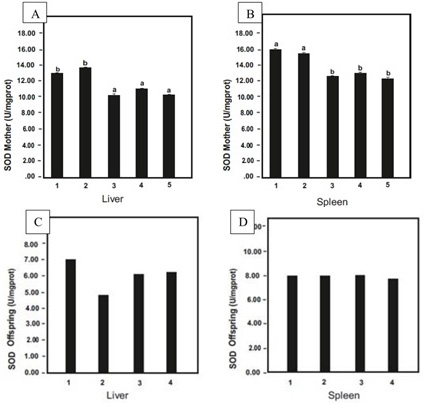
SOD levels of liver and spleen in mothers (A, B) and offspring (C, D). The SOD level in the maternal liver differs between the control group and the treatment groups infected with P. berghei. There are no significant differences on SOD Activity in offspring. Group 1: non-pregnant; Group 2: pregnant (Offspring 1); Group 3: pregnant-infected was injected with dose 1 (Offspring 2); Group 4: pregnant-infected was injected with dose 2 (Offspring 3); Group 5: pregnant-infected was injected with dose 3 (Offspring 4). Different letters above the bars indicate a significant difference (p<0.05).

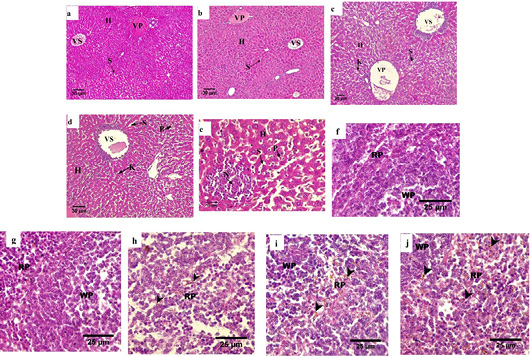
Hematoxylin–eosin-stained histological sections of the maternal liver (a-e) and spleen (f-j). For the liver, (a,b) normal hepatocyte devoid intracellular gaps; (c,d, e) infiltration of leukocyte and deposition of malarial pigment (H and E stained, 100x). (a) non pregnant, (b) pregnant, (c,d,e) pregnant-infected. For the spleen (f, g) normal texture of splenocytes; (h, i, j) expanded of red pulp along with the deposition of malarial pigments (H and E stained, 400x). (f) non-pregnant, (g) pregnant, (h, i, j) pregnant-infected. VS: central vein; VP: portal vein; S: sinusoid; N: necrosis; I: leukocyte infiltration; K: Kupffer cells; P: malaria pigmentation; WP: White pulp; RP: red pulp; Arrowheads: Hemozoin.
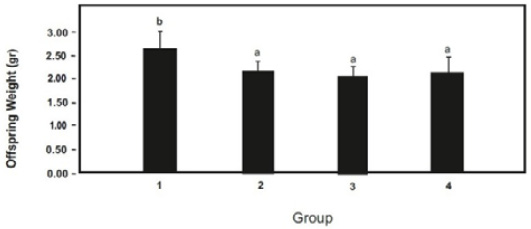
Offspring weight. ab Different letters indicate a significant difference (p<0.05).

