
Tea Out-grower Production and Marketing Challenges with Productivity and Efficiency Analysis using Stochastic Frontier Approach in Southwest Ethiopia


Research Article
Tea Out-grower Production and Marketing Challenges with Productivity and Efficiency Analysis using Stochastic Frontier Approach in Southwest Ethiopia
Yaregal Tilahun1*, Benyam Tadesse1, Getachew Mekonnen2 and Tilahun Bekele3
1Department of Agricultural Economics, College of Agriculture and Natural Resource, Mizan-Tepi University, PO.Box 260, Ethiopia; 2Department of Plant Science, College of Agriculture and Natural Resource, Mizan-Tepi University, PO.Box 260, Ethiopia; 3Department of Horticulture, College of Agriculture and Natural Resource, Mizan-Tepi University, P.O.Box 260, Ethiopia.
Abstract | Tea has a significant contribution to households’ cash income in the study area. However, decreasing productivity in the sector with price volatility led to a decline in output. Due to this fact, the studies were assessing the production trend with their bottlenecks, and identify the determinant of tea productivity and inefficiency through Cobb Douglas and stochastic frontier model. Data from a primary and secondary source of information were used from 135 tea out-growers. Based on the results, year 2017-018 has been used as production/base year. However, the productivity of tea in the 2020 production year is increased by 41.8% as the coverage of land for tea becomes increased by 53.6%. Lack of skill and knowledge (79.2%), lack of training and extension service 90.3%), low productivity (88.1%), the occurrence of pest and disease (80.7%), climate change (80.7%), weak market linkage (88.1%), monopoly market (69.2%, output price fluctuation (88.9%), and lack of centralized processing facilities (80.7%) were the key restraints on tea out-growers production and selling activity in the research area. The Cobb Douglas model indicated that labor force, fertilizer, land size, and improved seed all had an impact on tea productivity. While, technical inefficiency of tea production was determined by to level of education, the interaction of extension contact, distance to district market, harvesting time, training, and participation to off/non-farm income. So, improving the skill and knowledge of farmers through increasing extension service and training, on-time delivery of farm inputs, create market linkage, and improved tea nursery management were some of the suggestions made to alleviate the study areas’ tea production and marketing difficulties.
Received | July 19, 2021; Accepted | October 21, 2021; Published | December 22, 2021
*Correspondence | Yaregal Tilahun, Department of Agricultural Economics, College of Agriculture and Natural resource, Mizan-Tepi University, PO.Box 260, Ethiopia; Email: yaregalti@gmail.com
Citation | Tilahun, Y., B. Tadesse, G. Mekonnen and T. Bekele. 2022. Tea out-grower production and marketing challenges with productivity and efficiency analysis using stochastic frontier approach in Southwest Ethiopia Sarhad Journal of Agriculture, 38(1): 295-311.
DOI | https://dx.doi.org/10.17582/journal.sja/2022/38.1.295.311
Keywords | Cobb Douglas, Inefficiency, Constraints, Tea, Southwest Ethiopia
Introduction
Ethiopia’s is a lower developing country on which its economic development is highly dependent on the development of the agriculture sector which contributes 34.1% to the gross domestic product (GDP), 79% for earnings in foreign currency and 79% for job opportunities of the population (Diriba, 2020). The Ethiopia Agricultural Development-Led Industrialization policy (ADLI) realizes that agriculture is vital for economic growth (Ethiopia’s Ministry of Agriculture and Rural Development, 2010) through increasing agricultural profitability and poverty reduction (NPC, 2016). ADLI’s central premise is an export-led development plan aiming at boosting Ethiopia’s economic growth while also coordinating agricultural and industrial development. As to raise export promotion and import reduction in Ethiopia, the government has to intensify the production and productivity of tea in addition to coffee production since tea is an export crop which is highly significant to raise the income of the country (EIAR, 2017).
Tea [Camellia sinensis (L) O. Kuntze], is the supreme widespread and nethermost budget hot drink worldwide in general and Ethiopia in particular which is consumed by all levels of age groups with more than 3,000,000 cups daily all over the world (Hick, 2009; Zakir, 2017). Worldwide, tea after the coffee is the 2nd most used up and enjoyed a drink. It has pharmaceutical characteristics and can be used to treat a variety of human illnesses (Khan and Mukhtar, 2013). The Ethiopian tea research strategy (ETRS) has the mandate to research production-based technologies on tea out-growers to raise tea production and efficiency (EIAR, 2017). To achieve this, the research has given rise to high-yielding and improved seeds, usage of herbicides, pesticides, fertilizers and agronomic practices at recommendation rates (Hajiboland, 2017). Production-related information is commonly disseminated by ETRS through various publications, agricultural shows, and open days (Owuor et al., 2007; Gitahi, 2013).
Tea was originated in South East Asia, but due to its wide adaptability, it is grown under varying agro-ecological conditions throughout the world. Currently, tea is the furthermost worldwide consumed stimulant beverage followed by coffee and accounts for 46% of the world’s beverage market. Tea in Ethiopia, introduced in 1927, is relatively a new crop having a recent venture of commercial production. The initial purpose for commencing the tea farms in Ethiopia had been mainly to reduce imports and meet the ever-increasing local demand through increase tea production and productivity. However, a multitude of problems has been posing a severe threat to its development of which the major ones are: less attention to the tea sub-sector, lack of land use planning, capacity limitations, lack of input supply, absence of linkages among stakeholders, and conflict of interest among others.
Three estates (private tea plantations) produce tea: Wush-Wush and Gumero (Ethio Agri-Ceft P.L.C), and Chewaka (Ethio Agri-Ceft P.L.C) (East Africa P.L.C) in Southwest Ethiopia. Form the three estates of two of the estates present in the study area. Green tea leaves have also been produced and delivered to those three district areas by out-growers. Currently, the three estates have a total area under tea production of 2660 hectares, with out-growers having 437 hectares. The three estates produced 4570.78 tons of tea for export and 34,126.1 tons for the domestic market in the last five years (2011/12 to 2015/16). The tea industry in Ethiopia has provided income and employment opportunities to 575 out-growers, 7139 temporaries (labors who work and paid for specific activities within a short period) per annum, and 1157 permanent workers at tea estates or gardens (EIAR, 2017). There is also an increasing demand for tea production by out-growers near the two plantation sites. All these tea plantations are located in the agro-ecology that is highly suitable for tea production (MoA, 2011).
Despite the favorable environmental conditions for tea output quality in Ethiopia, the improvement of tea production, productivity, and output efficiency has been hindered due to the limitation of technology, weak adoption of production packages from abroad, and lack of tea research actions in the country (EIAR, 2017). In line with this, low product price, low product awareness, fluctuation in product demand, lack of warehouse, low quality of products, inactive participation of wholesalers on tea marketing activity, insufficient and confusing advertising, and low product diversification in domestic and export market were the major challenges which affect the expansion of tea production and marketing activity (Birhanu, 2016). Accordingly, there is a lack of research recommendations for increased production and productivity, scarcity of tea germplasm, and availability of a limited number of processing plants within the country in general in the study area in particular. Based on these constraints, the EIAR (2017) recommends future research on tea production, adoption of technologies suiting to our conditions, production and marketing activities, value chain, and post-harvest management for improved production and productivity of quality tea products for domestic and global markets.
Besides, no investigations were shown to have been carried out previously to evaluate the production and marketing trend with their constraints of tea farmers in the Kaffa and Shaka zone of South-West Ethiopia. Therefore, this study was focused on assessing the
Table 1: GTP-II targets for tea production (Qt) by Ethio-Agri-Ceft P.L.C. tea company.
|
Farm |
Area(ha) |
2015/16 |
2016/17 |
2017/18 |
2018/19 |
2019/20 |
|
Gimbo (Wush-Wush) |
1,249 |
43,750 |
45,009 |
46,250 |
47,500 |
48,750 |
|
Masha (Chewaka) |
482 |
15,370 |
16,720 |
17,535 |
18,430 |
19,480 |
|
Total |
1731 |
59,120 |
61,729 |
63,785 |
65,930 |
68,230 |
|
Productivity(Qt/ha) |
33.45 |
35.35 |
37.02 |
36.69 |
39.73 |
Source: Gimbo and Masha tea plantation planning
Table 2: GTP-II targets from tea production (Qt) from out-growers.
|
Farm area |
Years |
||||
|
2015/16 |
2016/17 |
2017/18 |
2018/19 |
2019/20 |
|
|
Gimbo (Wush-Wush) |
500 |
1,619 |
3,383 |
5,383 |
7,541 |
|
Masha (Chewaka) |
150 |
370 |
890 |
1,400 |
2,600 |
|
Total |
650 |
1,989 |
4,273 |
6,783 |
10,141 |
Source: Gimbo and Masha tea plantation planning.
production trend with their production and marketing constraints and identifying the determinant of tea production inefficiencies in the Kaffa (Gimbo) and Sheka (Masha) zone of South-west Ethiopia. The finding of the study would generate important information to intervene researchers, extension service providers, and policymakers for the same agro-ecological zones to invest in the development of tea production and productivity. In the same way, the finding of the study would result in a reference for other studies of students, and researchers who want to conduct further researches on a similar topic within the country or abroad.
Matrials and Mehtods
Trend of tea production and productivity in gimbo and masha
In Ethiopia, tea is ordinarily produced in the highland part of Southwest Ethiopia typically in dense forest regions where Arabica coffee is believed to be originated and thrives best under shade environments. The production trend of tea output in Ethiopia has intensely increased (Table 1) due to the factors of increased awareness of people about the nutritional and health benefits of drinking tea. The production and productivity of tea in the study area were increased due to an increase in local and foreign demand and the creation of fertile situations created by the government policies regarding reform and privatization of tea production (EIAR, 2017). However, the country is not achieving the expected benefit from the commodity for different reasons. According to EIAR (2017), due to shortage of trained professionals, awareness, and lack of strong research strategic plan are some of the major bottlenecks attributing to the slow expansion of the tea industry in the country specifically in the study area.
Since tea was introduced in Ethiopia in 1927, cultivation of the crop has expanded in terms of the area planted and the amount of tea produced. In the earlier four/five years (2014/15-2019/20), from about 4670 ha, the total production further increased from 8475 to 11,851 tons, 37% increment (Table 3) meeting growing local demand and export to new customers in Europe and the Middle East. The average productivity has also increased from 0.35 to an average of 0.38 tons of made tea per hectare (Table 1).
For the last five years (2015/16–2019/20, GTP-II), Ethio-Agri-Ceft P.L.C. Tea Company (the private company owning both Wush-Wush and Chewaka tea plantations) targeted to increase tea production, productivity, and export and the number of out-growers that produce tea on their farmland (Table 1 and 2). The plan will have significant bearings on the growth of the country and subsidize the significant shift in export development commodities that are at the core of GTP-II.
Demand for tea products
The most important aspect that influences consumers’ demand for tea products is the consumer’s attitude towards risks (FAO, 2015). The risk is a personal one (Bauer, 1960), which means that the demand of the consumer to pay tea product decisions is influenced by a lack of knowledge and experience. The greater the perceived danger, the less likely they were to perform the payment. As a result, one of the most significant barriers to purchasing is the perception of risk (Forsythe and Shi, 2003).
Comprehensive and strong selling schemes are critical to a company’s survival and expansion including the tea commerce and increasingly business environments to raise production and marketing efficiencies (Creveling, 2005). However, due to many production and organizational factors, achieving a professional and well-organized marketing strategy is tough for a company (McDonald, 1992; McDonald, 1996; Li et al., 2000).
Only the promotional activities that tea marketers engage in to gain more clients may set them apart. In the industry, poor quality has been identified as a serious problem. This happens when unscrupulous producers make a poor product process deliberately to increase volume and consequently make more money (Birhanu, 2016). This conduct, however, is considered risky to the buyer and the marketers since the producers may end up with inefficient products due to the poor quality that affects the demand for the product. As a result of these ownership structures, competitors are free to set their prices depending on their cost structures, market forces in their areas, and business operations.
World Bank (2004) revealed that, among the many constraints identified by the enterprise that limit, the key constraints which hinder the production and marketing expansion of tea are:
- Insufficient supply to meet market demand
- Need to address varietal improvement and better practices
- Improper management practices
- Adequate extension and planting materials provision to out-grower schemes
- Need for better quality packing material
- Lack of product availability due to too far in distance between manufacturing and place of product distribution
- Low product diversification in domestic and export market
- Lack of information and infrastructure are the major constraints that affect the company’s to market their product (in the foreign and domestic market).
Description of the study area
The research was carried out in the Kaffa zone in Gimbo district and Shaka zone in Masha district of Southwest Ethiopia (Figure 1). Shaka Zone is located at 7o24’-7o52’ north latitude and 35o13’-35o35’ east longitude, at a distance of 700 km from Addis Ababa. It covers about 2175.25 km2, out of which, 47% is covered by forest, including bamboo. The zone’s altitude extends from 900 to 2700 meters above sea level, and it receives a lot of rain, with an annual average of 1800 to 2200 mm and annual mean temperatures ranging from 15.1 to 27.5 degrees Celsius. While, the Kaffa zone is around 460 kilometers from Addis Ababa and 690 kilometers from Hawassa, the regional capital. The zone found at Latitude: 7°10’46.78”Longitude: 36°2’52.44”. The estimated terrain elevation above sea level is 1795 meters. The yearly mean temperature ranges from 14.1 to 26.5 degrees Celsius, with annual rainfall ranging from 400 to 2,000 millimeters (Figure 1).
Data types, sources and data collection method
To obtain qualitative and quantitative data, the study was used both primary and secondary data sources. The primary data were collected from a total of 135 sample households from both Gimbo and Masha districts using a semi-structured questionnaire. In addition to the questionnaire, checklists were used to acquire additional supporting material from Focus Group Discussions (FGDs), Key Informants (KIs), and extension agents’ interviews regarding the production trend, constraint, and determinant on tea production and output efficiencies in the study (Figure 2). The questionnaire was pre-tested and updated based on feedback received during the pre-test to assess the suitability of the design, clarity, question interpretation, and relevance of the questions before data collection. Subsequently, necessary modifications and amendments were made on questions those having puzzling and complex ideas identified by given experts.
Secondary data were collected through reviewing documents such as reports, documents from published and unpublished materials, district agricultural trade, and industry office. Furthermore, data on prices, land allocation, output, yield, and other socioeconomic indicators were gathered from these secondary sources.
Sampling procedure and sample size determination
The target populations for this study were tea out-growers with tea production and marketing activities.
The sampled household heads were chosen using a two-stage sampling technique. In the first stage from two zones (Kaffa and Shaka zone), two woredas were selected purposively since only two woredas were produced tea in the study area and only three woredas were produced tea in Ethiopia in general. In the second stage, about 135 sampled households (96 from Gimbo and 39 from Masha) were selected randomly for each tea out-grower using probability proportionate size. The number of sample households was determined by using the formula given by Yamane (1967) (n=N/1+N(e2). As a result, the required sample size is calculated at a 95% confidence level with a degree of precision of 9% to create a sample size that represents a true population.
Data analysis
The data which were collected from sampled households were analyzed using both econometric descriptive statistics. Descriptive statistics were analyzed through mean, percentage, frequency, and standard deviations on tea production and marketing-related constraints. An econometric model, Cobb-Douglas production function, and Stochastic Frontier model were used to assess the determinant of tea productivity and production inefficiencies. Multicollinearity, heteroscedasticity, and post-estimation of the stochastic frontier model were verified in the proposed explanatory variables.
Econometric model specification: Cobb Douglas’ production function was used to investigate the practical connection between agricultural productivity and several explanatory variables which was widely used by many scholars (Mengistu, 2014; Zinabu, 2016; Temesgen and Tufa, 2017; Kudama, 2019; Merga and Haji, 2019). The Cobb Douglass production function for this study was specified as:
 .......(1)
Where;
Y = tea productivity (quintal/hectare); A = constant term; X1, X2…, X6 are explanatory variables; α1, α2,….,α6 are coefficients of explanatory variables; D1, D2…, D6 are dummy variables; β1,β2…,β6 are coefficients of dummy variables, and Ui is the error term.
The linear transformation of the Cobb Douglass equation could be transformed into a natural logarithm function. Even though it is a more flexible variation of the Translog frontier, it is prone to multicollinearity (Thiam et al., 2001). A model of Cobb-Douglas is preferable to the Translog frontier because its coefficient directly represents the output elasticity of inputs and is easier to estimate.
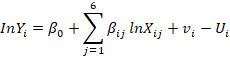 ........(2)
Where;
In= natural logarithm; Yi is the output of ith tea out-growers; Xij is input variables presented in (Table 3); βij represents the coefficients of explanatory variables of the stochastic production function model; and vi = random error, Ui = technical inefficiency term.
The stochastic frontier model (SFM): Crop productions in general and tea production in particular, are more probable which is influenced by beyond the control of tea out growers such as unexpected climatic conditions, natural hazards, presence of insects and pests. In addition, measurement and observational errors could also occur during data collection. To capture the effects of these errors, this study used a stochastic frontier model.
The model which was instantaneously introduced by Aigner et al. (1977) allows us to decompose the deviation of error term from the estimated frontier into random deviation of a two-sided random error outside the control of the firm and inefficiency (the one-sided efficiency component). The inefficiency score and inefficiency variables were specified as follows.
 ......(3)
Where;
ui is the technical inefficiency of the ith farmer; δi is a vector of a parameter to be estimated; wi is the error term; and X1, X2, X3, X4..., Xn are explanatory variables that affect production inefficiencies.
To estimate the level of technical efficiency and identify sources of technical inefficiency among tea out-growers, a single-step estimating approach was applied. The final empirical model estimated was specified as:
 .....(4)
Where;
Vi is the random error term, β1...,βn are coefficients of input variables, δ1…,δn are coefficients of inefficiency variables and εi is the disturbance term included in the model.
The existence of output inefficiency was investigated using the log-likelihood ratio test, which used the log-likelihood values of the inefficiency component to test the null hypothesis (Ho= γ=0) and the alternative hypothesis (H1: γ≠0). The discrepancy ratio (γ) can specify as:
 Where
Where 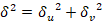 ......(5)
Table 3: Measurement and hypothesis of input and inefficiency variables used in the model.
|
Dependent variables |
Explanatory variables |
Unit of measurement |
Expected sign |
|
Productivity |
Labor Fertilizer Chemicals Land size Improved seed Agro-ecology |
Number Kilogram Litter Hectare Amount Categorical |
+ + + + + +/- |
|
Technical inefficiency |
Sex of household head Education level of household head Frequency of extension contact Training Participation of off/non-farm income Distance to district market Farm size Amount of credit taken Cooperative membership Experience in tea production Harvesting time |
Dummy(1=male),0=otherwise) Continuous (Years) Continuous (Number) Dummy (1=yes, 0=otherwise) Dummy (1=yes, 0=otherwise) Continuous (Hour) Continuous (Hectare) Continuous (Birr) Dummy (1=yes, 0=otherwise) Continuous (Year) Dummy(1=earlier, 0=otherwise) |
+/- - - - +/- + - - - - +/- |
The γ parameter has a value between 0 and 1. γ value of 0 indicates that the deviation of tea output from the frontier output is entirely due to random noise, while a value of 1 indicates that all deviations from the frontier are due to technical inefficiency. According to Caudill et al. (1995), the inefficiency function can specify as:
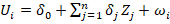 ..........(6)
Where;
Ui is the inefficiency scores for the ith farmer; Zi is the vector of explanatory variable which explains the producer’s inefficiency, δi is a vector of an unknown parameter to be expected, and ωi is unobservable random variables.
Definitions and measurements of variables: Tea productivity and technical inefficiency were both anticipated to be influenced by seventy explanatory variables (Table 3).
Results and Discussion
Socio-demographic characteristics of tea producers
Sex: The result in (Table 4) of the total sample respondents, 90.6% and 97.4% were male-headed households in Gimbo and Masha woreda respectively. This indicated that the production and productivity from input utilization up to output production were engaged by male households. This is well approved by Geremewe (2018) who reported as females’ have less opportunity to engage in farm production.
Marital status: Concerning marital status, 89.5% and 94.8 % of the total sample respondents are married in their consecutive district area. From the sampled tea growers, and woreda agricultural office suggests which individuals those who are married are more productive than the others who are a divorcee and alone tea grower’s because family members can participate and do different farmer activities on the field and the age between (15-64) are more productive and those who have more land are successful. The outcome is in line with the findings of (Markos, 2017).
Price trend (4-5 years price) and price-setting mechanism
An increase in agricultural product price with their price-setting mechanism of producers in general and tea out-growers were the main leading factors to boost their production and productivity. The result in (Table 4) found that from a total sampled tea growers 54.1%, 11.1%, 16.3%, and 18.5% revealed that in the last four/five years the tea price was increased, decrease, constant and become fluctuate respectively. The reason for an increase in the price of tea was owing to an increase in market demand of consumers, according to a focus group discussion, key informants, and the woreda agricultural office, even if market connection became weak. Since cooperation is important for smallholder farmers to get organized market information and deciding on output price, 86.5% and 74.4% of sample growers were not membership of cooperative in Gimbo and Masha respectively for coffee and other crops (Table 4). So, the practical application of tea out-growers delivering their final output to the company collectively determining and adjusting their market price becomes the most important challenge.
Table 4: Characteristics of sampled tea out-growers (dummy and categorical variables).
|
Variables |
Gimbo District |
Masha District |
|||
|
Frequency |
Percentage |
Frequency |
Percentage |
||
|
Sex |
Male |
87 |
90.6 |
38 |
97.4 |
|
Female |
9 |
9.4 |
1 |
2.6 |
|
|
Marital status |
Single |
10 |
10.4 |
2 |
5.2 |
|
Married |
86 |
89.5 |
37 |
94.8 |
|
|
Income source |
Agriculture |
95 |
98.9 |
39 |
100 |
|
Trade |
1 |
1.1 |
|||
|
Access to Extension service |
Yes |
31 |
32.3 |
32 |
82.1 |
|
No |
65 |
67.7 |
7 |
17.9 |
|
|
Credit access |
Yes |
51 |
53.2 |
30 |
76.9 |
|
No |
45 |
46.8 |
9 |
23.1 |
|
|
4-5 years price trend |
Increase |
52 |
54.2 |
21 |
53.8 |
|
Decrease |
11 |
11.4 |
4 |
10.3 |
|
|
The same |
13 |
13.5 |
9 |
23.1 |
|
|
Fluctuate |
20 |
20.8 |
5 |
12.8 |
|
|
Cooperative membership |
Yes |
13 |
13.5 |
10 |
25.6 |
|
No |
83 |
86.5 |
29 |
74.4 |
|
|
Price setting |
Buyers |
95 |
98.9 |
38 |
97.4 |
|
Sellers |
1 |
1.1 |
1 |
2.56 |
|
Source: Own survey result, 2020
The result in (Table 4) shows that about 98.9% and 97.4 of the tea plantation farmers responded that they sold the tea for the price given by buyers (factory) at Gimbo and Masha district respectively. This demonstrates that the tea market in the research area is dominated by “one-buyers” who determine the price. This suggests that the selling price is not determined by the relationship between demand and supply, which is a non-competitive nature of the tea market system. Therefore, most of the tea out-growers are enforced to sell at whatever price given by the factory.
Farming experience: The level of experience of the household head is taken as the number of years since the household head has been started in engaging in the production and selling of tea. The survey result found that the average years of experience for sampled tea growers were 7.4 and 6.3 years in Gimbo and Masha respectively which implies that the cultivation of tea in the study area is not stretched many years long ago.
Extension service: Even if frequent use of institutional and credit services has vital importance to promote agricultural production and marketing activity, only 46.6% and 60% of tea growers can get extension service from extension agents and credit access from the company and their relatives respectively. This indicated that almost more than half of the sample respondents cannot get organized information and training on seed preparation, production, harvesting, marketing, and value addition activity (Abay, 2010; Meaton et al., 2015; Agize and Zouwen, 2016). Tegegne (2008) and Urgessa (2011) indicated that households who took credit for cotton and teff production had supplied more amounts of cotton and teff to market than those who did not. According to Kabungo (2008), a limiting factor that slows down input consumption and output commercialization is access to credit facilities, particularly financing for crop production.
Age and education level: The average age of tea growers in Gimbo and Masha district were 39.9 and 36.6 years respectively which indicated that tea growers are found in middle productive age (Table 5). Concerning education, the average level of education of households was 5.3 and 5.42 years in Gimbo and Masha district respectively. It is believed that if the education level of the producers becomes increases, there would
Table 5: Characteristics of sampled tea producers (Continuous variables).
|
Variables |
Ginbo District |
Masha District |
||||||
|
Mean |
Std. Dev. |
Min. |
Max |
Mean |
Std. Dev. |
Min. |
Max |
|
|
Age (years) |
39.9 |
12.6 |
26 |
69 |
36.4 |
9.8 |
29 |
62 |
|
Experience in tea farming (years) |
7.45 |
9.6 |
3 |
12 |
6.3 |
7.3 |
3 |
11 |
|
Education level (years) |
5.3 |
3.32 |
0 |
13 |
3.6 |
5.42 |
0 |
9 |
|
Family size (numbers) |
6.4 |
3.03 |
3 |
13 |
5.2 |
3.8 |
2 |
11 |
|
Working-age (numbers) |
4.2 |
4.6 |
2 |
7 |
3.4 |
3.7 |
1 |
6 |
Source: Own Survey result, 2020; Std. Dev. = Standard deviation
be a possibility to accept new ideas and innovations to increase him/her farm income (Negera, 2015; Agize and Zouwen, 2016). In line with sampled growers; focus group discussion and key informants in both districts revealed that tea growers who can read and write are more productive and successful than their counterparts.
Land allocation, production and average market price trends of tea (2017- 2019)
In the study area, the land is possibly the single most important factor of production and a measure of wealth. In the 2017/18 production year, the maximum size of land allocated for tea plantations at Gimbo and Masha was 10.3 and 2.75 hectares with a yield of 1355.47quintal and 316.25 quintals respectively. In (Table 6) described that the average area cultivated for tea plantation was increased with an increase in the average quantity produced of tea output with their respective market price. But, the result obtained from focus group discussion and key informants revealed that the productivity of tea does not increase as compared with increasing its land allocation. The main reason behind this occurrence was due to high production cost, storage facility problem, shortage of farm input and farm inputs, weak extension contact, lack of credit service, and lack of processing facilities.
As we use the 2017/18 production year as a base year, the production of teas was increased by 22.7% and 21.8% in Wush-Wush and Chewaka as their land allocation for tea was increased by 31% and 27.3% in Wush-Wush and Chewaka respectively in 2018/19 production year. While in 2019/20 the production of tea in Wush-Wush and Chewaka was increased by 18.8% and 48.3% as the allocation of land was increased by 9.6% and 34.4% in Wush-Wush and Chewaka district as the production year of 2018/19 was used as a base year. Regarding the price of tea output, the price of tea was increased from 16.3% in the 2018/19 production year to 24.3% in both districts as we use the 2017/18 production year as a base year (Table 6). From this, we can conclude that the trend of tea productivity is not increased as like an increase in allocation of land for tea production due to different production and marketing constraints (lack of well-organized market linkage among tea out-growers and other chain actors).
Table 6: Total land, production, and average marketing price from 2017-2020.
|
Years |
Variables |
Gimbo District |
Masha District |
|
20017/18 |
Land allocation |
10.3 hectare |
2.75 hectare |
|
Total yield |
1355.47 Qt |
316.25 Qt |
|
|
Price |
270.37 Qt-1 |
80 birr Qt-1 |
|
|
2018/19 |
Land allocation |
13.5 hectare |
3.5 hectare |
|
Total yield |
1663.95 Qt |
385 Qt |
|
|
Price |
350.74 Qt-1 |
300 birr Qt-1 |
|
|
2019/20 |
Land allocation |
14.8 hectare |
5.25 hectare |
|
Total yield |
1978.36 Qt |
603.7 Qt |
|
|
Price |
356.58 Qt-1 |
300 birr Qt-1 |
Source: Own survey result, 2020; where Qt=quintal and Qt-1=per quintal tea chain actors.
The conclusions of this study agree with those of Tanui et al. (2012) and Negera (2015), who found that lack of well-standardized inputs, lack of improved varieties and technology, lack of processing facility, fragmented land sizes, lack of agronomic practice, and lack of extension and training center were the major factors which hinder the productivity of cardamom spice. In line with this Markos (2017) revealed that lack of storage facility, unable to get a fair price, lack of market linkage, weak market information, high production cost, shortage of farmland, lack of credit service, weak extension support, and high rent of land are the major constraints which hinder the production and productivity of tea.
Regarding the price, the price of the product was slightly and continuously increased with an increase in the quantity supply of tea but the quantity demand of the product is unpredicted and inconsistent (Table 6). In the past three/four years the price of the product and its supply showed an inverse relationship while with a positive relationship with the quantity demand for the product. The demand for tea is one of the vital influential factors which influence the development of the tea economy (Baffes, 2004). Therefore, the tea market demand with its supply for the product was affected by its price and related products. Since we use coffee as a substitute product which is the consumer in place of tea, the demand for tea becomes decreased. As a result of their findings, Muthamia and Muturi (2015) revealed that tea export revenues fluctuated upwards from 1980 to 2011, causing tea growers’ profitability to suffer.
Since southwest Ethiopia is a potential for coffee production, most consumers consume coffee at least twice a day which leads to a reduction in the demand for tea. So, as the tea demand is directly related to the price of its coffee products, most consumers can use and consume coffee instead of tea in line with their surplus production of coffee in the study area. The finding is honorable with the find of Tanui (2005) and Urgessa (2016) found that the tea market becomes fluctuated and unstable due to product quality, packaging, and geographical distance across the country. Similarly, a ten percent increase in green tea retail prices will result in a drop in demand for green tea from 6.9 percent to around 10 percent (Chang, 2015).
Tea production and marketing constraints
Production constraints: Several constraints are enlightened by tea producers during the production phase. According to the findings, the key restrictions currently impeding the development of tea production and marketing may be divided into farm level and marketing constraints (Table 7). At the farm-level, key restraints challenged by tea out-growers are low productivity 119(88%), lack of training and extension service 122 (90.3%), low price of product 120(88.8%), climate change 115(85.2%), monopoly market 109(80.7%), shortage of labor force 97(71.8%), lack of skill and knowledge 107(79.3%), lack of mechanized harvesting machine 97(71.8%0, shortage of farm inputs 94(69.6%), and the high price of inputs 92(68.1%).
Besides to sampled households, focus group discussions and key informants revealed that lack of improved seedling, lack of training and awareness from seed plantation to output production, lack of agronomic practices, lack of fertilizers, weak linkage among tea growers and extension agents, lack of processing facilities, high input price, lack of governmental intervention and lack of mechanized harvesting system were time major factors which hinder tea production and productivity. Therefore, the establishment of tea processing plant near to the farm is vital for tea out-growers to increase their value addition, market efficiency and creating a vertical integration of
In addition to sampled respondents, the sampled group discussion and key informants revealed that the occurrence of climate change on tea production can reduce the production and productivity of tea. They revealed that due to the incidence of climate change; reduce its quality, the appearance of new pests and diseases, reduced biodiversity and ecosystem function, uncertainty with the application of fertilizers and reduce their yield with quality. The findings are in line with those of Maina et al. (2015), and Zakir (2017) confirmed that increase in climate change can reduce the yield and quality of tea, increase disease and pests, and reduce soil content. So, the research has given to rise high-yielding clones, selective application of recommended herbicides and fertilizer rates, and harvesting practices to raise their yield (Owuor et al., 2007; TRFK, 2011).
Marketing constraints: The survey results in (Table 8) showed that from a total of 135 sampled respondents; lack of market linkage among chain actors 119(88.1%), unfair price-setting strategies 104(77.1%), monopoly of tea market 94(69.6%), lack of effective and efficient market 109(80,7%), lack centralized processing facility 85(62,9%), inefficient and confusing advertising promotion strategies 69(51.1%), low and volatile output price 89(65.9%), lack of wholesalers involvement in tea market 62(45.9%) and lack of well-organized market information 81(60%) were the major constraints which affect the marketing activity tea growers in both Chewaka and Wush-Wush area.
According to the result of Li et al. (2000), it is difficult for a business to establish a successful and effective marketing strategy. The lack of well-skilled organizational managers was one of the constraints which hinder the achievement of excellent marketing (McDonald, 1992). The fact is that environmental
Table 7: Constraints that hinder tea production by tea out-growers.
|
Constraints |
Gimbo |
Masha |
Average |
|
Frequency (%) |
Frequency (%) |
Frequency (%) |
|
|
Low productivity |
85 (88.5%) |
34 (87.2%) |
119 (88.1%) |
|
High input price |
65 (67.7%) |
27 (69.2%) |
92 (68.1%) |
|
Shortage of input |
69 (71.9%) |
25 (64.1%) |
94 (69.2%) |
|
Lack of credit access |
59 (61.4%) |
19 (48.7%) |
78 (57.8%) |
|
Shortage of labor force |
76 (79.2%) |
21 (53.8%) |
97 (71.8%) |
|
Lack of skill and knowledge |
71 (73.9%) |
36 (92.3%) |
107 (79.2%) |
|
Climate change |
84 (87.5%) |
31 (79.5%) |
115 (85.1%) |
|
Poor infrastructure development |
38 (39.6%) |
16 (41.0%) |
54 (40.0%) |
|
Lack of training and extension service |
87 (90.6%) |
35 (89.7%) |
122 (90.3%) |
|
Lack of mechanized harvesting systems |
71 (73.9%) |
26 (66.6%) |
97 (71.8%) |
|
Lack of government intervention |
51 (53.1%) |
18 (46.2%) |
69 (51.1%) |
|
Low price of product |
83 (86.4%) |
37 (94.8%) |
120 (88.9%) |
|
Pest and disease |
79 (82.3%) |
30 (76.9%) |
109 (80.7%) |
Source: Own survey result, 2020
Table 8: Constraints that affect tea marketing by sampled tea growers.
|
Constraints |
Gimbo |
Masha |
Average |
|
Frequency (%) |
Frequency (%) |
Frequency (%) |
|
|
Lack of market linkage |
85 (88.5%) |
34 (87.2%) |
119 (88.1%) |
|
Price setting problem |
73 (76.1%) |
31 (79.5%) |
104 (77%) |
|
Monopoly market |
66 (68.7%) |
28 (71.8%) |
94 (69.2%) |
|
Lack of effective and efficient market |
79 (82.3%) |
30 (76. %) |
109 (80.7%) |
|
Lack of centralized processing facility |
60 (62.5%) |
25 (64.1%) |
85 (62.9%) |
|
Inefficient and confusing advertising |
51 (53.1%) |
18 (46.2%) |
69 (51.1%) |
|
Low and price fluctuation |
69 (71.8%) |
20 (51.3%) |
89 (65.9%) |
|
In active participation of wholesalers |
48 (50%) |
14 (35.8%) |
62 (45.9%) |
|
Unable to get real price information |
59 (61.4%) |
22 (56.4%) |
81 (60%) |
Source: Own survey result, 2020.
factors generally interact astonishingly and affect the successful of managers in strategic marketing issues (McDonald, 1996). According to Cooper and Kleinschmidt (2007), a tea grower company must first collect related market information, evaluate the internal and external environment and resources, and plan development strategies for new products that align with business goals in order to improve new product development performance.
Opportunity of tea production and marketing: Despite the existence of constraints along with tea production and marketing of the research area, there are also huge opportunities from input delivery up to end consumption. Huge demand to buy improved disease-resistant quality seed, farm equipment, fertilizers, and chemicals are opportunities identified at the input provision stage. Production opportunities include tea growers’ desire to produce vast amounts, increasing replanting rate of existing estates through flexible, affordable, and innovative financing system, numerous product diversification opportunities through improved varieties, good experience in tea production, and presence of suitable soil and agro-ecology for tea production. Similarly, marketing opportunities include: high demand for the product all over the year, value addition opportunities, the establishment of cooperatives, willingness of actors to tea make linkage, and availability of supportive government policies and offices (district agriculture & industry offices) to implement the policies. Concerning consumption level of consumers, high demand for consumer preference to consume tea products is an opportunity to expand tea production and marketing.
Econometric analysis
Productivity analysis: The estimated coefficients of the Cobb-Douglas stochastic factor of production was used to determine the efficiency level of tea productivity (Table 9). Tea output was the dependent variable in the model, while land designated for tea production, use of chemical and fertilizer, labor in terms of man equivalent, harvesting time, and agro-ecological zone were the independent variable. Among six inputs used in the model; improved seed, land, labor, and usage of fertilizer had a significant influence on tea output disparity among sample out-growers (Table 9).
Table 9: MLE for coefficients of Cobb Douglas production function.
|
Variables |
Coefficients |
Standard Error |
|
Labor |
0.087** |
1.371 |
|
Fertilizer |
0.363* |
0.069 |
|
Land |
0.904*** |
0014 |
|
Chemicals |
-0.016 |
0.002 |
|
Improved seed |
0.071*** |
0.011 |
|
Agro ecology |
0.036 |
0.105 |
|
Constant |
3.943 |
0.514 |
|
Model Diagnostic Statistics |
||
|
Total variance |
0.051*** |
|
|
Gamma |
0.783*** |
|
|
Lambda |
4.936 |
|
|
Log-likelihood function |
-205.476 |
|
|
Wald chi2 (7) |
89.78 |
|
|
Total number of observation |
275 |
|
|
Mean technical efficiency |
57.6% |
|
*, ** and *** means significant at 10, 5, and 1%, respectively.
Source: Own survey result, 2020
The model in (Table 9), showed that the variance of the technical inefficiency parameter gamma is 0.783 and significantly at a 1% level of significance which is different from zero. This indicated that 78.3% of the variation in tea productivity from the frontier among sample out-growers was due to differences in technical inefficiency while the remaining 21.7% was due to constraints beyond the control of out-growers. The positive elasticity of inputs indicates improves the use of that input which would give a significant improvement in tea output while the negative coefficient indicates a reduction in tea output.
Land size: is a continuous variable measured in hectares that is significant at the 1% significance level and whose coefficient is positively connected to tea productivity (Table 9). The result of the coefficient indicated that as the land size increase by 1% will increase tea productivity by 90.4% keeping other factors constant. The positive association suggests that the more land given to tea production, the more tea can be produced and the more productive it can be. The result by Geremew et al. (2018) revealed that there is a direct connection between land allocation and crop production and productivity and would increase market supply.
Improved seed: the coefficient of improved seed was positive as expected and significant at a 1% significance level. According to the finding, as compared to the use of local seed a 1% increase in the usage of improved seed had significantly increase tea output by 7.1% keeping other inputs constant. According to Baisa(2009), the most essential input that boosts production and productivity while also increasing farm income is the adoption of enhanced seeds.
Fertilizer use: The result in (Table 9) confirms that the application of fertilizers (DAP and Urea) has a positive coefficient as expected. The use of fertilizer has a substantial influence on tea productivity at a 10% significance level which indicated that there is a direct connection between tea productivity and fertilizer use on a given land size. The coefficient of fertilizer use indicated that a 1% increase in fertilizer application can increases tea productivity by 36.3% as citrus paribus.
Labor force: it significant at a 5% level of significance and the positive result revealed that there the relation between number of labor employed on a tea farm and tea productivity is a direct association. The outcome of the coefficient indicated that a 1% increase in number of labor will improve tea productivity by 8.7% as other input variables were constant. The outcome is in line with Tadesse et al. (2021) finding who revealed that there is a direct connection between the numbers of family size (labor force) and crop productivity.
Estimation of tea out-grower efficiency
Regarding technical efficiency in (Table 9), the mean technical efficiency of sample farmers was 57.6% with a standard deviation of 10.4%. This suggests that there are no substantial alterations among tea out-growers in the research area, and that we can increase tea production efficiency by improving existing inputs and technologies. As a result, the sample respondents’ productivity can be enhanced by 42.4 percent if appropriate steps are adopted to improve the efficiency of tea-growing farmers, according to the mean degree of technical efficiency.
Determinants of technical inefficiency in tea out-growers
To investigate the determinant of efficiencies or inefficiencies of tea production, eleven explanatory variables were used. Among those eleven variables, year of education, frequency of extension contact, distance to district market, harvesting time, experience of tea production, and training were the main influences identified for tea efficiency (Table 10).
Table 10: Maximum-likelihood estimates on the determinant of technical inefficiency.
|
Variables |
Coefficient |
Standard Error |
|
Sex of the household head |
-0.036 |
0.02 |
|
Education level of household head |
-0.362*** |
0.08 |
|
Frequency of extension contact |
-.781*** |
0.61 |
|
Training |
-0.984** |
0.09 |
|
Participation of off/non-farm income |
0.286** |
0.14 |
|
Distance to nearby market |
0.614** |
0.21 |
|
Farm size |
-0.237 |
0.15 |
|
Amount of credit taken |
-0.094 |
0.07 |
|
Cooperative membership |
-0.106 |
0.13 |
|
Experience in tea production |
-0.083 |
0.05 |
|
Harvesting time |
-1.583*** |
0.42 |
|
Constant |
-6.641*** |
0.93 |
** and *** denote statistically significant at 5% and 1% significance level, respectively
Source: model output result, 2020
Education level: At a 1% significance level, there is a statistically significant and negative association between the education level of household heads and the technical inefficiency of tea production. This meant that a 1% increase in the level of education of the sampled respondents would result in a 36.2 percent reduction in tea inefficiency. The result indicated as the year of education among tea out-growers becomes higher can understand, perceive and interpret agricultural advice easily, can accept and adopt new and improved agricultural technologies, and can get up-to-date agricultural information compared to less educated or uneducated household heads. This result is in line with the findings by (Beyan et al., 2013; Debebe et al., 2015; Tadesse et al., 2021).
Frequency of extension contact: There is a statistically significant and negative association at 1% level of significance between the frequency of extension contact and the technical inefficiency of tea production. The result indicated that a 1% raise in frequency extension contact would reduce tea inefficiency by 78.1%. This implies that the extension contact can provide information on fertilizer use, seedling raising, and harvesting times that will help them increase tea production and productivity. The finding is in line with the outcome of Tadesse et al. (2021) who found that extension contact and crop production inefficiency are negatively and significantly correlated.
Participation in non/off-farm activities: There is a statistically substantial and negative association between non/off-farm activity and technical inefficiency of tea production at a 5% significance level. The result indicated that participants of household heads in non/off-farm activities had a positive impact to increase technical inefficiency in tea production than those who had not to participate. It indicated that a 1% increase in participation of off/non-farm activity will increase tea inefficiency by 28.6%. The reason behind this is that farmers who allocate more of their time to non/off-farm activities can engage less time to crop and agricultural activities (Bachewe et al., 2019).
Distance to nearby market: the result found that distance to nearby market affects positively and significantly the technical inefficiency of tea production at a 5% significance level. The result revealed that farmers whose farm or house is far from the district market had more inefficient than those whose farm is closer to the district market. The result implied that a 1% increase in district market walking hours increases crop inefficiency or reduces crop efficiency by 61.4%. The result is consistent with the finding of Tesfaw et al. (2021) and Tadesse et al. (2021) found that there are a direct association among distance to market and teff and crop production inefficiencies respectively.
Harvesting time: the outcome of the model found that there is a significant and negative relationship between early harvesting and technical inefficiency of tea production at a 1% level of significance. The result revealed that harvesting on time is significantly increasing the technical efficiency of tea production and vice versa. The possible reason is harvesting on time reduces wastes, post-harvest losses, unexpected weather conditions, and reduces shattering during gathering and mowing.
Training: this variable would improve the production capacity of the sample tea out growers was hypothesized to determine the technical inefficiency of the sample out-growers negatively and significantly at a 5% significance level. The result indicated that giving training to tea out-growers has a negative influence on the technical inefficiency of tea production. So, giving training and awareness to tea out growers at right time with the right place is crucial to increase their skill and knowledge and can increase their tea production efficiencies.
Conclusions and Recommendations
Tea is the supreme known which accounts for the lowest cost in terms of drinking in worldwide which is more than billion cups were consumed by all age groups in every country in general and Ethiopia in particular. Even though tea has a significant contribution to households’ cash income in the study area tea production, productivity, and marketing activity are not well-developed which are affected by different constraints and experienced by lack of a properly functioning marketing system. Due to this fact, this study was aimed to assess the production and productivity trend with their bottlenecks of tea production, productivity, and marketing in the Wush-Wush and Chewaka districts of Southwest Ethiopia. Data on qualitative type were collected through focus group discussions, key informants’ interviews, and observations. The data were produced from both primary and secondary sources. The primary data from 135 tea out growers were collected using semi-structured questionnaires.
The result obtained from the sampled respondents, focus group discussion, and key informants revealed that the production of tea in both districts becomes increases but its productivity is not increased as compared with increasing its land allocation. As the land covered by tea was increased by 53.6% in the 2020 production year, the productivity of tea becomes increased by only 41.8%. This indicated that the productivity of tea is not increased as like an increased land coverage for tea. The main reasons behind this were the occurrence of various tea production and marketing constraints. Lack of skill and knowledge for tea growers (79.3%), lack of training and extension service (90.3%), the occurrence of disease and pests (79.6%), climate variability (85.2%), lack credit access (59.7%), low productivity (88%), low output price (90.6%) with high input price (68.1%) are the major constraints which hinder the expansion of tea production and productivity in the study area.
In addition to production, weak market linkage among tea marketing actors (88.1%), monopolized market (69.6%), lack of efficient and competitive market (80,7%), low and fluctuation output price (65.9%), inactive participation of wholesalers (45.9%), presence of illegal traders, lack of updated market information (58.9%), and lack of centralized processing facilities (62.9%) are the major tea marketing constraints in the study area.
The model by Cobb Douglas result found that tea productivity was affected by the labor force, fertilizer, land size, and improved seed. In line with this, the factors influencing the technical inefficiency of tea production were determined by the stochastic frontier model. The result revealed that level of education, frequency of extension contact, distance to district market, harvesting time, training, and participation to off/non-farm income were significant variables that influence tea production inefficiency.
Based on the given empirical finding of the study, the following recommendations were forwarded to boost and reduce tea productivity and inefficiency respectively. Therefore, improving extension service through a build up the capacity of extension agents and skill of farmers through practical based training and awareness is decisive to enhance and improve the production and productivity of tea growers by applying proper tea management practices, timely delivery of farm input like an improved seed, fertilizer, credit access, processing materials, and access to market and market linkage. So, providing more processing machines through creating tea out-growers in cooperation and one more additional processing machine to the company must be needed to harvest and supply their product to the market on time to raise their income of both the grower and the company. In addition to this, the local government should support tea out growers by providing information to different causal laborers to participate on time of harvest time to minimize output losses.
The local and zonal government should strengthen the development of infrastructure (market, electricity, road, and transport services) to minimize travel time, increase the participation of hired labor at peak agronomic practices, accessing up-to-date production and marketing information, and increase market linkage were some of the recommendations forwarded to reduce tea production and marketing challenges in the study areas. Finally, different scholars should do different socio-economic production and marketing-related activities, soil assessments, and quality assessment issues and physicochemical characteristics of the tea to expand the tea production system in all kebeles and different areas of the same agroecology.
Novelty Statement
The aim of this study was assessing the production trend with their bottlenecks, and identifies the determinant of tea productivity and inefficiency through Cobb Douglas and stochastic frontier model. The researchers work is original work.
Author’s Contribution
Yaregal Tilahun and Benyam Tadesse: Proposal development, data collection, data analysis and final write up.
Getachew Mekonnen and Tilahun Bekele: Data collection and write up.
Conflict of interest
The authors have declared no conflict of interest.
References
Abay, A. 2010. Market chain analysis of red pepper: the case of Bure woreda, west Gojjam zone, Amhara National Regional State, Ethiopia (Doctoral dissertation, Haramaya University).
Agize, M. and Zouwen, L. 2016. Spice and medicinal plants production and value chain analysis from South-West Ethiopia. J. Pharm. Altern. Med. (www.iiste. org), 10.
Aigner, D., Lovell, C.K. and Schmidt, P. 1977. Formulation and estimation of stochastic frontier production function models. J. Econ., 6(1), 21-37. https://doi.org/10.1016/0304-4076(77)90052-5
Bachewe, F. N., Koru, B. and Taffesse, A.S. 2019. Productivity and efficiency of smallholder teff farmers in Ethiopia. Gates Open Res., 3(208): 208.
Baffes, J. 2004. Tanzania’s Tea Sector: Constraints and Challenges’. https://doi.org/10.1111/j.1467-8659.2004.00239.x
Baisa, G.A. 2009. Commercialization of smallholder farming: determinants and welfare outcomes: a cross-sectional study in Enderta district, Tigrai, Ethiopia (Master’s thesis, Universitetet i Agder: University of Agder).
Bauer, R.A. 1960. Consumer behavior as risk taking. In Proceedings of the 43rd National Conference of the American Marketing Assocation, June 15, 16, 17, Chicago, Illinois, 1960. American Marketing Association.
Beyan Ahmed, J.H. and Geta, E. 2013. Analysis of farm households’ technical efficiency in production of smallholder farmers: the case of Girawa District, Ethiopia. J. Agric. Environ. Sci., 13(12): 1615-1621.
Birhanu, U. 2016. Challenges and opportunities of tea marketing in the case of east african agri-business private limited company. Doctoral dissertation, St. Mary’s University.
Creveling, 2005. Making a case for business and marketing planning. Rough Notes, 137(3): 26-32 developing economies. Utilities Policy 9 131 – 157.
Caudill, S.B., Ford, J.M. and Gropper, D.M. 1995. Frontier estimation and firm-specific inefficiency measures in the presence of heteroscedasticity. J. Bus. Econ. Stat., 13(1), 105-111. https://doi.org/10.1080/07350015.1995.10524583
Chang, K. 2015. World tea production and trade: Current and future development. Food and Agriculture Organization Of The United Nations, Rome.
Cooper, R.G. and Kleinschmidt, E.J. 2007. Winning businesses in product development: The critical success factors. Res. Technol. Manage., 50(3): 52-66. https://doi.org/10.1080/08956308.2007.11657441
Debebe, S., Haji, J., Goshu, D. and Edriss, A.K. 2015. Technical, allocative, and economic efficiency among smallholder maize farmers in Southwestern Ethiopia: Parametric approach. J. Dev. Agric. Econ., 7(8): 282-291. https://doi.org/10.5897/JDAE2015.0652
Diriba, G. 2020. Agricultural and Rural Transformation in Ethiopia: Obstacles, Triggers and Reform Considerations.
EIAR. 2017. Ethiopian Institute of Agricultural Research, National Tea Commodity Research Strategy (2016 – 2030), January 2017.
Ethiopia’s, A.S.P. and PIF, I.F. 2010. Federal Democratic Republic of Ethiopia Ministry of Agriculture and Rural Development.
FAO. 2015. World tea production and trade, Current and future -development=determinants of the tea market
Forsythe, S.M. and Shi, B. 2003. Consumer patronage and risk perceptions in Internet shopping. J. Bus. Res., 56(11): 867-875. https://doi.org/10.1016/S0148-2963(01)00273-9
Geremewe, Y.T. 2018. Potato (Solanumtuberosum L.) Market Chain Analysis: The case of Sekela District, West Gojjam Zone, Amhara National Regional State, Ethiopia.
Gitahi, D.N. 2013. Role of Labor Supply Credit Access on Food Security In Small Scale Tea Farming In Kenya (Doctoral dissertation).
Hajiboland, R. 2017. Environmental and nutritional requirements for tea cultivation. Folia Hortic., 29(2): 199-220. https://doi.org/10.1515/fhort-2017-0019
Kabungo, C.V. 2008. Evaluation of Irish potato production and marketing performance: A case study of Mbeya Rural District, Mbeya Region, Tanzania (Doctoral dissertation, Sokoine University of Agriculture).
Khan, N. and Mukhtar, H. 2013. Tea and health: studies in humans. Curr. Pharm. Des., 19(34): 6141-6147. https://doi.org/10.2174/1381612811319340008
Kudama, G. 2019. Factors influencing coffee productivity in Jimma zone, Ethiopia. World J. Agric. Sci., 15 (4): 228–234.
Li, S., Kinman, R., Duan, Y. and Edwards, J.S. 2000. Computer-based support for marketing strategy development. Eur. J. Mark., https://doi.org/10.1108/03090560010321938
Markos, H. 2017. The Role Of Tea Plantation In Livelihood Enhancement Of The Individual Farmers In Gimbo Woreda, Southwest Ethiopia (Doctoral dissertation, ASTU).
McDonald. 1996. Strategic marketing and firm performance. J. Mark., 2(4): 23-40.
McDonald, M.H. 1992. Strategic marketing planning: a state-of-the-art review. Mark. Intell. Plan., https://doi.org/10.1108/02634509210016632
Meaton, J., Abebe, B. and Wood, A.P. 2015. Forest Spice Development: the use of value chain analysis to identify opportunities for the sustainable development of Ethiopian cardamom (korerima). Sustain. Dev., 23(1): 1-15. https://doi.org/10.1002/sd.1563
Mengistu, G. 2014. Technical efficiency in onion production: The case of smallholder farmers in Dugda Woreda, East Shewa Zone, Ethiopia. Haramaya: Haramaya University, School of Graduate Studies.
Merga, B. and Haji, J. 2019. Factors impeding effective crop production in Ethiopia. J. Agric. Sci., 11(10): 1-14. https://doi.org/10.5539/jas.v11n10p98
Muthamia, A.K. and Muturi, W. 2015. Determinants of earnings from tea export in Kenya. J. World Econ. Res., 4(1): 15-22. https://doi.org/10.11648/j.jwer.20150401.12
Negera, D.G. 2015. Analysis of factors determining the supply of Ethiopian cardamom spice (Aframomum corrorima): a case from Bench Maji zone of SNNPR, Ethiopia. Eu. J. Bus. Manage., 7(1): 56-63.
NPC (National Planning Commission). 2016. Federal democratic republic of Ethiopia: Growth and transformation plan II (GTP II) (2015/16-2019/20). Addis Ababa, Ethiopia.
Owuor, P.O., Kavoi, M.M., Wachira, F.N. and Ogola, S.O. 2007. Sustainability of smallholder tea growing in Kenya.
Tadesse, B., Tilahun, Y., Bekele, T. and Mekonen, G. 2021. Assessment of challenges of Crop Production and Marketing in Bench-Sheko, Kaffa, Sheka, and West-Omo Zones of Southwest Ethiopia. Heliyon, e07319. https://doi.org/10.1016/j.heliyon.2021.e07319
Tanui, J.K., Feng, W., Shen, S., Zeng, L. and Xinghui, L. 2012. Global tea price volatility, coping strategies, and China production.
Tea Research Foundation of Kenya (TRFK). 2011. Strategic Plan 2010-2015. Retrieved from: http://www. www.tea research.or.ke, (Accessed on: February 14, 2012).
Tegegne, B. 2008. Analysis of cotton marketing chains: The case of Metema Woreda, North Gondar Zone, Amhara National Regional State (Doctoral dissertation, Haramaya University).
Temesgen, A. and Tufa, A. 2017. Analysis of coffee farm productivity in Darolabu District, West Hararghe Zone, Ethiopia. Am. J. Environ. Resour. Econ., 2(4): 158-161.
Tesfaw, Z., Zemedu, L. and Tegegn, B. 2021. Technical efficiency of Teff producer farmers in Raya Kobo district, Amhara National Regional State, Ethiopia. Cogent Food Agric., 7(1): 1865594. https://doi.org/10.1080/23311932.2020.1865594
Thiam, A., Bravo-Ureta, B.E. and Rivas, T.E. 2001. Technical efficiency in developing country agriculture: a meta-analysis. Agric. Econ., 25(2-3): 235-243. https://doi.org/10.1111/j.1574-0862.2001.tb00204.x
Urgessa, B. 2016. Challenges And Opportunities of Tea Marketing in the case of East African Agri-Business Private Limited Company (Doctoral Dissertation, St. Mary’s University).
Urgessa, M. 2011. Market chain analysis of teff and wheat production in Halaba Special Woreda, southern Ethiopia (Doctoral dissertation, Haramaya University).
World Bank. 2004. Opportunities and Challenges for Developing High-Value Agricultural Exports in Ethiopia.
Yamane, T. 1967. Problems to accompany Statistics, an introductory analysis. Harper & Row.
Zakir, M. 2017. Review on tea (Camellia sinensis) research achievements, challenges and future perspective including Ethiopian status. Int. J. For. Hortic., 3(4): 27-39. https://doi.org/10.20431/2454-9487.0304005
To share on other social networks, click on any share button. What are these?


