

miR-22-3p Suppresses Adipocyte Formation of Telomerase Transformed Mesenchymal Stromal Cells (iMSC3) by Regulating Non-targeted MAPK Signaling Pathway


miR-22-3p Suppresses Adipocyte Formation of Telomerase Transformed Mesenchymal Stromal Cells (iMSC3) by Regulating Non-targeted MAPK Signaling Pathway
Sara Sultan Alomran1, Muhammad Nasir Khan Khattak1,2, Amir Ali Khan1,2*, Sallam Hasan Abdallah2, Abeer Maher Fayyad1 and Khalid Bajou1,2

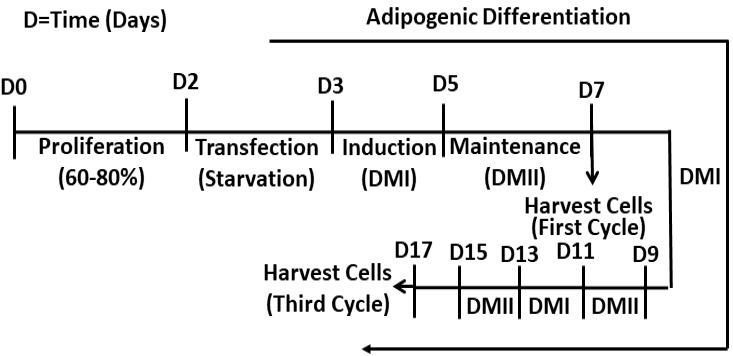
Flow chart illustrating transfection and adipocyte differentiation of iMSC3 cells via methodology used in this study.

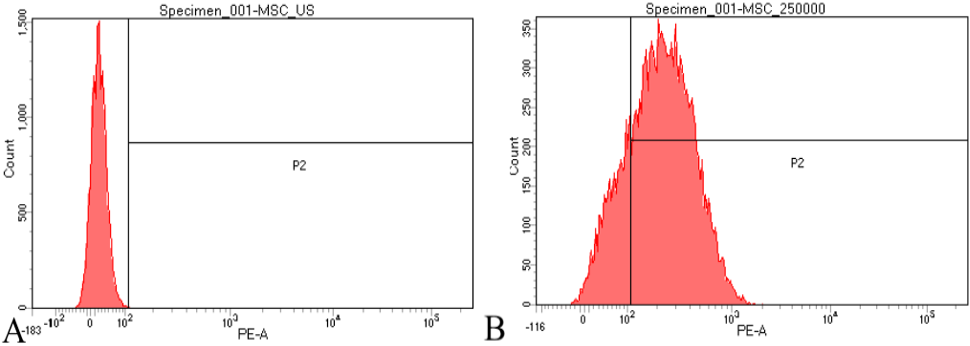
iMSC3 cell transfection efficiency using flow cytometry. A, non-transfected iMSC3. B, iMSC3 cells transfected with non-target miRNA labeled with CY3.
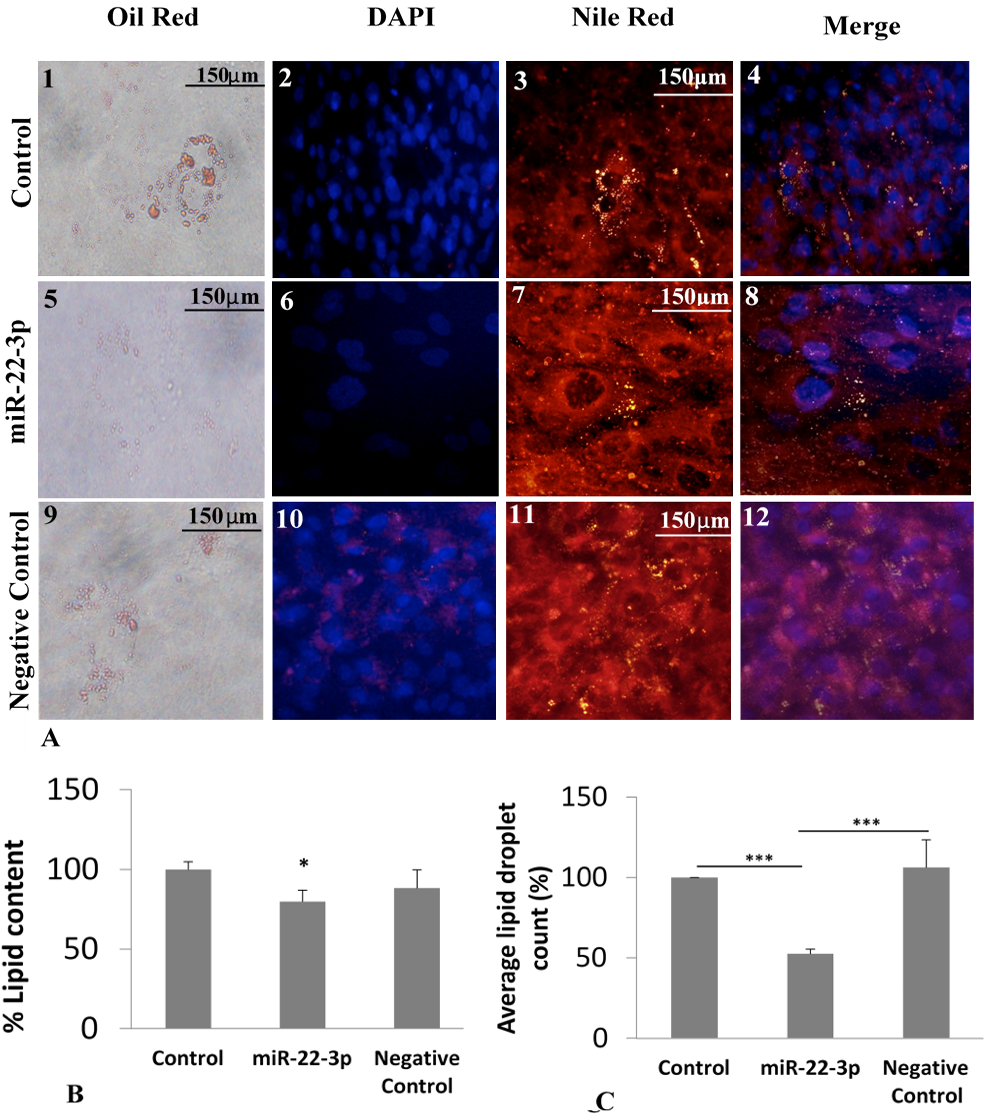
Morphological effects of miR-22-3p transfection (lipid content and lipid droplet count) on the differentiation of iMSC3 cells into adipocyte. To determine the effect of the transfection into adipocyte, Oil red, DAPI and Nile red staining were performed. A, 1-4 shows control lipid droplets in oil red and Nile red, cell nucleus in DAPI, and merged DAPI/Nile red. 5-8, miR-22-3p transfected cells and 9-11 negative control cells, respectively. B shows lipid content from iMSC3 cells differentiated into adipocytes. C shows the average number of fat droplets from different treatment groups. The experiments were performed in triplicates and the average percentage values were calculated. The data is presented as mean ± S.D. p=0.34, * p < 0.05, ** p<0.01, *** p<0.001 versus control or negative control groups.
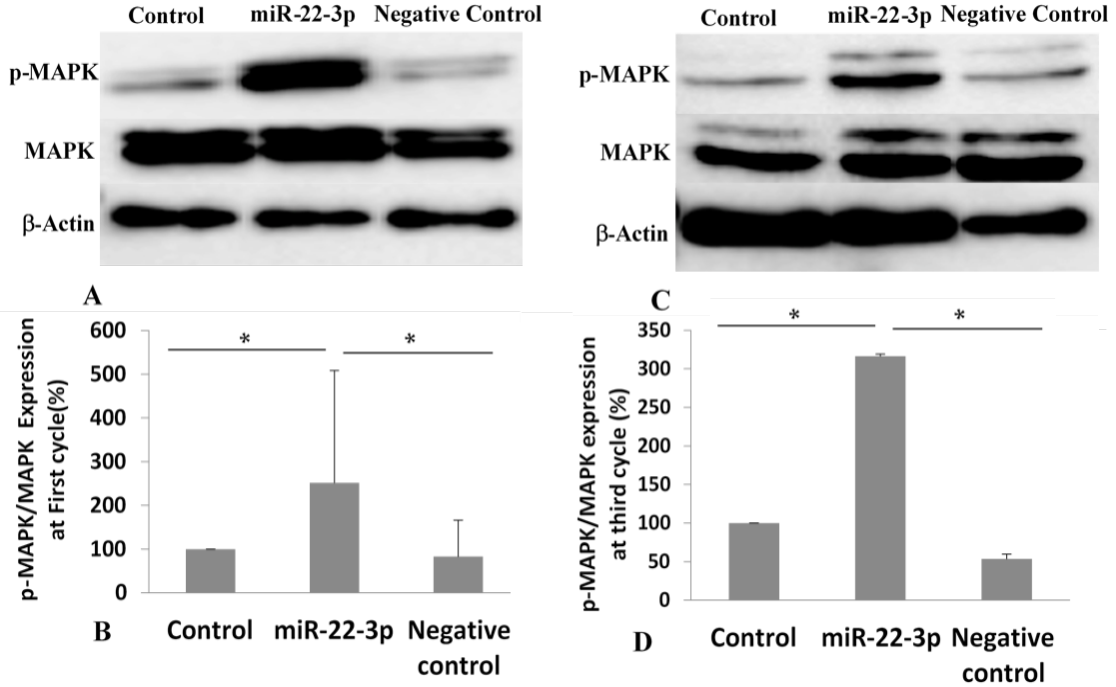
Representative immunoblots showing expression of β -actin, total MAPK and phosphorylated MAPK along with graph of p-MAPK/MAPK relative expression. A, B, In the first cycle of differentiation to adipocytes, the immunoblots show an upregulation of p-MAPK in miR-22-3p transfected cells in comparison to control and negative control groups. C, D, Representative immunoblots and graph following the third cycle of differentiation. The results also indicate an upregulation of p-MAPK at this stage. Experiments were performed in triplicates and the average percentage values were calculated. The data is presented as mean ± S.D * p < 0.05, versus control and negative control groups.

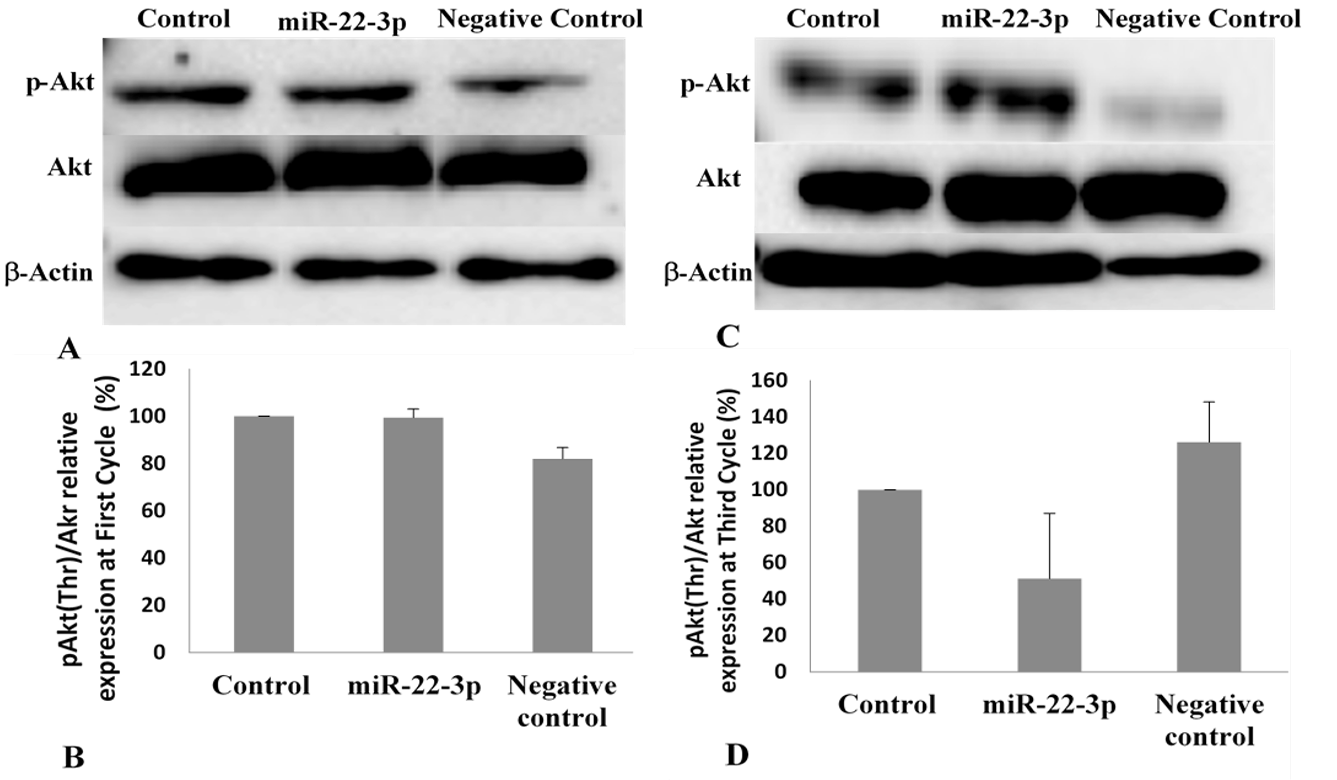
Representative immunoblots showing expression of β-actin, total Akt and phosphorylated Akt (Thr) along with graphic representation of p-Akt/Akt relative expression (A, B). In the first cycle of differentiation to adipocytes, immunoblots show an upregulation of p-Akt in miR-22-3p transfected cells in comparison to control and negative control groups (C, D). Representative immunoblots and graph following the third cycle of differentiation also indicate an upregulation of p-Akt (Thr) at this stage. Experiments were performed in triplicates and the average percentage values were calculated. The data is presented as mean ± S.D. The results were not statistically significant.


