
Supply Response Analysis of Gram in the Context of Prices and Non-Prices Factors in Punjab, Pakistan


Research Article
Supply Response Analysis of Gram in the Context of Prices and Non-Prices Factors in Punjab, Pakistan
Naheed Zahra*, Muhammad Qasim, Muhammad Azam Niazi, Muhammad Ishaq and Mubbashira Nazir
Pakistan Agricultural Research Council, Islamabad, Pakistan.
Abstract | Pluses play a very vital role in nutritional food security however in Pakistan this sector was neglected in the past. This study aims to examine the supply response of major pulse gram in the context of price and non-price factors and to analyze gram production scenario at Punjab, Pakistan by applying ARDL approach. In this study secondary data was used from 1980 to 2018. The estimated results of the study revealed that own prices of gram pulse have positive but statistically insignificant impact on pulses’ production. This can possibly be explained by the fact that pulses are considered a risky crop due to yield fluctuations when compared to the competing cereal and other cash crops. Gram production in the Punjab is negatively affected by frequent unfavorable weather and disease incidences. Its production was found to be inversely related to the prices of wheat the major competing crop. This shows that as prices of competing crops increase the comparative profitability of gram decreases and hence its production decreases compared to competing crops. It is recommended that as gram producers are risk averse and prefer crops with sustained profitability so there is a need for policy package for improving gram production in gram area. The package may include gram crop insurance packages to farmers that motivate them to enhance the area under gram. To make gram competitive there is need to provide level playing field i.e., support price policy, for gram as is provided to wheat the major competing crop in the pulses area.
Received | July 01, 2022; Accepted | September 20, 2022; Published | December 01, 2022
*Correspondence | Naheed Zahra, Senior Scientific Officer, Pakistan Agricultural Research Council (PARC); Email: naheedrizvi83@gmail.com
Citation | Zahra, N., M. Qasim, M.A. Niazi, M. Ishaq and M. Nazir. 2022. Supply response analysis of gram in the context of prices and non-prices factors in Punjab, Pakistan. Sarhad Journal of Agriculture, 38(5): 193-201.
DOI | https://dx.doi.org/10.17582/journal.sja/2022/38.5.193.201
Keywords | Agriculture, ARDL, Gram, Punjab-Pakistan, Supply response
Copyright: 2022 by the authors. Licensee ResearchersLinks Ltd, England, UK.
This article is an open access article distributed under the terms and conditions of the Creative Commons Attribution (CC BY) license (https://creativecommons.org/licenses/by/4.0/).
Introduction
Pulses are considered important for improving both the soil and human health. It is a vital part of human diet in food basket (FAO, 2016). Legumes crops have the ability to grow under marginal lands, and rainfed conditions and complex production environments. Overall pulses are climate change resilient crop with diverse stress tolerance traits (Darai et al., 2021). During the green revolution more attention was paid on cereal while legumes were totally overlooked which is fundamental part of agriculture (Ali et al., 2005). The further negligence of pulses in research and development led to stagnation and even decline in yield of pulses (Ali and Abedullah, 1998). The need for pulses is steadily increasing due to rising population, but supply is unable to keep up with the rising demand (Savadatti, 2018).
The United Nations declared 2016 to be the Global Year of Pulses, and they were proclaimed as nourishing seeds for a maintainable future. Pulses are the most important source of vegetable protein in Pakistan. They are grown on around 5% of the total planted area. The human consumption of pulses is more than 60% of the production, with average consumption 7 kg per person per year (FAO, 2018). Further, day by day Pulses of demand are increasing due to rising population. Pakistan is importing large amounts of pulses due to low pulses production and to satisfy the ever-increasing gap between supply and demands (Chaudhry et al., 2002). Currently, Pakistan is producing only about 713.6 thousand tons of pulses. The rest of these pulses have to be imported to fulfill the country requirement. Therefore, the import bill of pulses surged by Rs. 68265.3/- million during 2018-19 (GoP, 2019). In Pakistan pulses crops remained subsistence, low-input intensive and low profitable, not because these qualities were inherited, but because they were deprived from the package of technological innovations that can help them in transformation from subsistent to commercial crops. With no significant technological innovation in pulses production in Pakistan, their yields remained stagnant and even decline, supplies lagged behind demand, and ultimately prices shot up (Khan and Hussain, 2007). The most important pulse crop in Pakistan is gram that accounts 62 percent of the entire pulses production in Pakistan. Gram is cultivated extensively as a winter crop in Pakistan. Due to favorable weather conditions prevailing at the moment of sowing, gram yield increased by 35.6 percent during the year 2018-19 (GoP, 2019).
Pakistan is the world’s third largest producer of gram after India and Australia (FAO, 2020), yet its output is insufficient to meet the country’s demands. Punjab is the province with the largest agricultural production in Pakistan. On average, The Punjab province produced 86% of Pakistan’s gram production, while Sindh, Khyber Pakhtunkhwa, and Baluchistan provided the remaining 14% (GoP, 2019). Due to its low fertility and lack of irrigation, the Thal desert is an ideal location for cultivating gram because no other crop can be cultivated profitably in this area. In the Thal desert’s marginal soils, gram can generate higher yields when subjected to moisture stress (Baig, 2018). The Khushab district supplied 28% of the gram production in Punjab, with the rest coming from all other districts. Pulses are a crucial part of subsistence farmers’ cropping systems in the Khushab district, where no other crop grows as well. Pulses help in the management of agricultural fertility, particularly in the Nurpur Thal desert’s dry fields. Gram production is the main livelihood of rural and urban people in the Nurpur Thal desert The Thal region produces a significant volume of pulses. The cultivated area under gram shows an increasing trend over time while the trend in its production fluctuates wildly hinting at the yield variability (Ghafoor and Nazam, 2016).
For increasing the production of gram one of the most important factors supply response which needs concentration. This tells farmers responsiveness to economic incentives mainly describes the contribution of agriculture sector to the economy. Supply response is one of the major problems among agriculture-based economies, as the response of the farmers towards the economic benefits mainly determines the agriculture’s role to the economy. Moreover, in the farm supply response analysis, one of the critical economic factors determining the production decision of farmer is Price (Khan and Hussain, 2007). There is a main role of agriculture pricing policy in enhancing both agricultural output as well as income, and supply response is a base to understand this price mechanism (Nerlove and Bachman, 1960). Due to increasing population and less profitability there is need of efficient utilization of agricultural land for enhancing gram production. There is urgent need to determine the response of farmers in the context of price and non-price factors. This will help in farming policies for gram crop to narrow the gap between demand and supply.
Materials and Methods
Universe of the study
The present study covers the major chunk of gram producing areas of Punjab. Secondary data on gram production, Price of gram, competing crop (Wheat) price, DAP and Rain fall for the time period 1980-2018 were used in the study. To collect the data on gram production for Punjab those districts were selected for analysis that were producing 80 percent of gram. The selected districts were Bhakkar, Khushab and Layyah. Data for selected districts were collected from Crop Area and Production by District. Annual provincial level data from 1980 to 2018 was obtained from different issues of Pakistan Economic Survey, Agricultural Statistics of Pakistan, Punjab Development Statistic and Crop Reporting Services Punjab. Data for rainfall was taken from the Pakistan Meteorological Department. Data on input and output prices of gram, prices of competing crop (wheat) and DAP were collected from Agricultural Statistics of Pakistan.
The co-integration analysis was done with the help of E-views software. The nominal values of gram input and output prices were transformed to real values using the GDP deflator. Natural logs of all of the variables were taken to deal with the data skewness and narrowing the variation among the time series data.
Data analysis
Conceptual framework: Considering the existing literature on supply response in terms of research methodology, it is clear that prior studies were not based on modern time series analytical methodologies, and their results were considered unsatisfactory until and unless the stationarity issue was not taken into account in these studies. Those empirical studies were based on traditional econometric techniques like (Nerlove’s framework, 1958; Askari and Cumming, 1977; Savadatti, 2018; Riaz et al., 2014; Khan, 2010). However, research conducted by (Abou-Talib et al., 2008; Alemu et al., 2003) reported various weaknesses of Nerlovian partial adjustment model. First, this model fails to cope with short as well as long-term elasticities. Secondly, the non-stationary series analyzed under this model has more chances of spurious results of the regression. Due to these limitations, Nerlovian Partial Adjustment model is found less appropriate for supply response analysis, and Autoregressive Distributed Lag (ARDL) technique is given preference over Nerlovian Partial Adjustment for research methodology. Most of the studies recommended the Autoregressive Distributed Lag (ARDL) model when there is a mixed order of integration as ARDL can take enough numbers of lags to estimate the data generating process (Halam and Zanoli, 1993; Akanni and Okeowo, 2011; Pesaran et al., 2001).
An ARDL is a regression technique with both dependent and independent variable are in their lags form. The number of lags of the explanatory variable is denoted by ARDL (p, q).
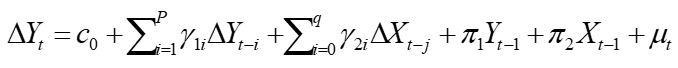 …. (1)
Supply response model for gram
Production of gram crop is thought to be influenced by its own price, the prices of other crops such as cotton, wheat, and DAP, as well as non-price factors such as rainfall at gram sowing time.
Gram Production= f (Gprice, Wprice, DAPprice, Rain_sow) λ
Writing this equation statistically
Gram prodt = λ1Gpricet+λ2 Wpricet + λ3Dappricet + λ4Raint + μt …… (2)
Where; GR Price= Ln of gram real price; W Price= Ln of wheat real price; DA Price= Ln of DAP real price; Rain= Ln of rainfall.
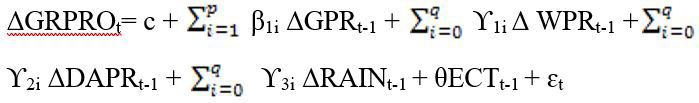
ARDL model for gram

Error correction model for gram
Results and Discussion
Stationarity test
A variety of tests for determining unit root are available, each with its own set of benefits, drawbacks, and applicability in particular situations. Although pre-testing for stationarity is not required in this investigation, while using the ARDL technique. However; it is sufficient to ensure that not a single variable is I (2), as this technique requires. In the case of shorter data series, ADF and especially PP tests have the maximum power. Because the current study had a limited data set, ADF and PP tests were considered adequate.
The majority of the lag selection criteria were used to determine the lag numbers. The Schwartz Bayesian Criterion (SBC), Akaike Information Criterion (AIC) and Hannan Quinn Criterion (HQC), are the most often used criteria, however other software uses additional criteria as well (Shrestha et al., 2018). All of the variables were stationary at the level and
Table 1: Augmented dickey fuller test.
|
At level |
At first difference |
||||
|
Constant |
Constant and trend |
Constant |
Constant and trend |
||
|
Variables |
t Statistics |
t Statistics |
t Statistics |
t Statistics |
Decision |
|
Gram prod |
-6.65*** |
-7.06*** |
- |
- |
I (0) |
|
Gram price |
-3.40** |
-3.16 |
- |
- |
I(0) |
|
Wheat price |
-2.05 |
-2.09 |
-6.04*** |
-5.09** |
I(1) |
|
DAP price |
-1.93 |
2.46 |
-6.16*** |
-6.11*** |
I(1) |
|
Rain |
-7.65*** |
-7.82*** |
- |
- |
I(1) |
Source: Author’s calculations SIC criteria was used for lag length selection. *, **, *** =significant @1,5 and 10% level, respectively.
Table 2: Philips-perron (PP) test.
|
At level |
At first difference |
||||
|
Constant |
Constant and trend |
Constant |
Constant and trend |
||
|
Variables |
t-Statistics |
t-Statistics |
t-Statistics |
t-Statistics |
Decision |
|
Gram Prod |
-6.64*** |
-7.32*** |
- |
- |
I(0) |
|
Gram Price |
-3.15** |
-2.81 |
-6.94*** |
-11.5*** |
I(1) |
|
Wheat Price |
-2.39 |
-2.09 |
-3.56*** |
3.59*** |
I(1) |
|
DAP Price |
-1.89 |
-2.62 |
-6.16*** |
-6.11*** |
I(1) |
|
Rain |
-7.60 |
-7.82*** |
I(0) |
||
Source: Author’s calculations SIC criteria was used for lag length selection. *, **, *** =significant @1, 5 and 10 % level, respectively.
first difference. The findings of both tests were nearly identical (Tables 1 and 2). The outcomes are consistent with previous findings (Mushtaq and Dawson, 2002; Mohammad et al., 2007). Almost all of the variables are highly significant at the level, and the first differences demonstrate that none of the variables are I (2), which makes the ARDL approach viable for use.
Bound test
Variations in gram production are thought to be impacted by changes in its own price, wheat price, DAP price, and rainfall at sowing time. The Schwartz Information Criteria (SIC) was employed to pick lags because it produces relatively sparse lags, which is better suitable for smaller samples like the ones used in this study. Using the Eviews software iteration method, a variety of models was assessed, and the one with the best statistic was ultimately selected.
LnGP(1), lnGPR(1), lnWhPR(3), lnDAPR(1), lnRain (4) are the lags for each variable. The bounds test was used to determine whether the dependent and explanatory variables have a long-term relationship. At all levels of significance, the estimated F value of 20.30 was more than the upper bound value. As a result, even at a 1% level, the null hypothesis of no long-run association is rejected. The small sample bounds given by Narayan (2005) were estimated and are shown in Table 3.
Table 3: Bounds testing for gram (1, 1, 3, 1, 4).
|
Test statistic |
Value |
K |
|
F-statistic |
20.30** |
4 |
|
Critical value bounds (Narayan) |
||
|
Significance |
I(0) bound |
I(1) bound |
|
10% |
3.03 |
4.06 |
|
5% |
3.47 |
4.57 |
|
1% |
4.4 |
5.72 |
Source: Author calculation. **, *, *** =significant @5, 1, and 10% level, respectively.
To acquire insight into the supply response of gram, the long-run coefficients for the four independent variables were calculated. The long run coefficients result of ARDL indicated that gram production is not responsive to its own respective price as it is statistically insignificant. The reason may be the gram is relatively low priority crop grown on the marginal land with low rainfall and no supplement irrigation. The same result was observed in earlier studies (Ali and Abdullah,1998).
Wheat crop is the major competing crop for gram production in the core gram production area because of its overlapping period. The ARDL results indicate that the strong inverse relationship of wheat price with gram production with very high value of coefficient. This shows that one percent increase in price of wheat results in 4.41 percent decline in gram production. Same type of results was indicated by previous studies (Ali and Rashid, 2009). The major reason may be that wheat is the first-choice crop and with increase in wheat support prices farmers switch to wheat crop sacrificing the gram production. The findings of (Fahimifrad and Saboui, 2011; Shahzad et al., 2018) on wheat price and gram production were also provides similar results. This finding supplements the facts that cereals are one of major factor for displacement of pulse production (Grace et al., 2014). Being the same season crops, and risk and uncertainty attached to gram farmers usually prefer to grow wheat than gram crop (Ahmad et al., 1993).
Prices of major input like DAP fertilizer has positive relationship with gram production as the results indicate that relationship statistically significant. The results demonstrate that, with the rise in DAP price by 1 percent will induce to increase gram production by 0.85 percent. As gram is a second-choice crop and needs lesser fertilizers as compared to major competing crop i.e., wheat so the increase in DAP prices results in shift of wheat sowing to gram sowing and hence gram production increases. This can be generalized increase in prices of major inputs may lead to shift the area allocation from cereals with input requirements towards pulses crops with low input requirement in the core gram producing area.
Rainfall is an important variable as the crop is grown mainly in rain-fed areas and, mostly depends on rainfall. The results variable rainfall at sowing period has inverse relationship with gram production. The negative sign is unexpected for the relationship of rain at sowing and gram production. The major reason behind this may be the rainfall at sowing time would lead to more wheat sowing as compared to gram. Wheat crop is sown almost one month later than gram crop so rainfall at gram sowing time may lead to more preference for wheat sowing as 1st choice crop than gram. The other reason may be that wheat moisture requirement is relatively higher than that of gram so in case of sufficient rains at sowing time farmers may prefer to sow wheat instead of gram and hence gram production declines. These results were also confirmed by (Tuteja, 2006; Kumar and Bourai, 2012). An increase in rainfall results in reduction of the area under pulses crops, because traditional kinds of pulse crops provide low yields and profitability as compare to superior cereals.
Table 4: Long-run coefficients for gram.
|
Variable |
Coefficient |
Std. error |
t-Statistic |
p value |
|
Gram price |
0.457 |
0.31 |
1.43 |
0.17 |
|
Wheat price |
-4.41 |
1.31 |
-3.36 |
0.00* |
|
DAP price |
0.85 |
1.30 |
4.19 |
0.00* |
|
Rain at sowing time |
-0.84 |
0.25 |
-3.34 |
0.00* |
|
Constant |
-3.71 |
4.66 |
-0.79 |
0.43 |
|
Trend |
-0.01 |
0.024 |
-3.89 |
0.00* |
Source: Author’s calculations. *, **, *** =significant @1, 5 and 10%, respectively.
Table 5 shows the short-run results of the calculated model. In the short run, the majority of the coefficients are significant according to the calculated values. The error correction term’s value was highly important and had a negative sign. Because of its size, any disequilibrium would be totally remedied throughout this time period.
Table 5: Short–run results for gram.
|
Variables |
Coefficient |
Std. Error |
t Statistics |
Probab. |
|
d (gram price) |
0.03 |
0.26 |
0.12 |
0.90 |
|
d (lpricewht) |
0.55 |
0.58 |
0.95 |
0.35 |
|
d (lpricewht (-1)) |
-1.79 |
0.70 |
-2.56 |
0.02 |
|
d (lpricewht (-2)) |
3.05 |
0.71 |
4.26 |
0.00 |
|
d (lprice dap) |
-2.33 |
0.47 |
4.95 |
0.00 |
|
d (lprice dap (-1)) |
-0.98 |
0.58 |
-1.67 |
0.11 |
|
d (lprice dap (-2)) |
-1.00 |
0.51 |
3.08 |
0.00 |
|
d (lprice dap (-3)) |
-2.28 |
0.50 |
-4.45 |
0.00 |
|
d (lrain sow) |
0.00 |
0.05 |
-0.02 |
0.98 |
|
d (lrain sow (-1)) |
0.00 |
0.08 |
-0.00 |
0.99 |
|
d (lrain sow (-2)) |
0.37 |
0.08 |
4.54 |
0.00 |
|
d (lrain sow (-3)) |
0.57 |
0.09 |
6.36 |
0.00 |
|
d (trend) |
-0.14 |
0.02 |
-4.91 |
0.00 |
|
ECT [-1] |
-1.0 |
0.13 |
-7.82 |
0.00 |
Source: Author calculation Note: ‘d’ is difference operator.
Diagnostic tests
The robustness of the derived regression model was assessed using a series of diagnostic tests. Coefficient diagnostics lag structure, and residual diagnostics are
|
Test |
Test statistics |
p-Value |
Null hypothysis |
Decision |
|
Breusch-godfrey LM test |
20.59 |
0.74 |
No Serial Correlation |
Accept Ho |
|
Breusch-pagan test |
14.62 |
1.00 |
Constant Variance |
Accept Ho |
|
Ramsey RESET test |
3.53 |
0.36 |
Model has no omitted variables |
Accept Ho |
|
Jarque-bera test |
3.04 |
0.21 |
Regression residuals are normally distributed |
Accept Ho |
Source: Author’s calculations.
the most common diagnostic categories, with residual being the most essential. The frequently recognized residual diagnostics procedures of model specification test of omitted variable, autocorrelation, stability test, and normality test, that were utilized to discover the problem of heteroscedasticity (Shrestha and Bhatta, 2018).
The Durbin Watson (D.W) test is often used to examine autocorrelation; however, it is only valid for first-order autocorrelation and is inefficient in autoregressive models with autocorrelation already handled (Anyaeji, 2017). The Lagrange Multiplier (LM) test, which can provide helpful information on higher order autoregressive errors and can be used to detect any serial correlation in the model, can be utilized to avoid this problem. According to the test results, the derived model showed no autocorrelation issues. The regression is considered to be heteroskedastic when the variance of the error term does not remain constant during the series. The Breusch-Pagan-Godfrey test was used to confirm the presence of heteroscedasticity in the calculated model. The model’s estimated results revealed no evidence of heteroscedasticity. The Ramsey RESET test is used to look for any model misspecification. It examines the Ho that the model has no essential omitted variables for explaining the dependent variable. The computed regression passed the Ramsey test, indicating that the model does not have anymis-specification issue. The Jarque-Bera test is used to determine whether the model regression residuals are normal. Normality is one of the assumptions that must be met in order for the regression results to be valid and robust (Jarque and Bera 1980). The normality of the regression residuals was tested using this test, while the data follows a normal distribution, according to the findings.
(CUSUM Squared) test for checking stability
CUSUM tests were used to test the model’s log-run stability. This test is based on the recursive cumulative sum. It is used to deal with parameter instability in the 5% range. When the blue line lies between the two red lines, hence declaring that the estimation is stable. The estimation is consistent as seen in Figure 1.
Conclusions and Recommendations
In this study supply response of gram in Punjab is estimated during 1980-2018 by applying ARDL approach. The findings of this study revealed that both input-output prices and non-price factors had an impact on gram production. The estimated results demonstrated that gram producers are responsive to both input and output pricing, in contrast to several earlier studies from the 1960s that showed non-responsiveness. It is obvious from the data that farmers are price responsive and receive a greater price than competitive crops such as cereals. The inference might draw from the results that, despite high prices of pulses, farmers do not receive reasonable returns for their outputs as a result of reduced and also unstable pulse yields, which are a result of the risk and uncertainty component involved in pulse production.
In terms of production the gram has shown either stagnant or slightly positive and negative changes in production during the last one and half decade. The cultivated area under gram has an increasing trend over time while the trend in its production fluctuates wildly hinting at the yield variability. The susceptibility of gram low yield potential is due to traditional poor seed varieties, highest acceptability of disease, weather uncertainties and poor crop management practices, that affect the pulses production in Punjab, Pakistan.
Rainfall is an important variable as the gram crop is grown mainly in rain-fed areas. The results variable rainfall at sowing period has an inverse relationship with gram production. The negative sign is unexpected for the relationship of rain at sowing and gram production. The major reason behind this may be the rainfall at sowing time would lead to more wheat sowing as compared to gram. Wheat crop is sown almost one month later than gram crop so rainfall at gram sowing time may lead to more preference for wheat sowing as 1st choice crop than gram. The other reason may be that wheat moisture requirement is relatively higher than that of gram so in case of sufficient rains at sowing time farmers may prefer to sow wheat instead of gram and hence gram production declines. In gram DAP impact was statistically significant with positive relationship as increase in DAP price will increase the production of gram. There has been a little attention given to pulses sector by policy makers and researchers. It is suggested that as farmers are risk averse and prefer crops with sustained profitability, there needs to be a two-pronged approach. First is the policy front, where;
- In the short run a gram package needs to be offered in the defined gram area where a buy back guarantees and provision of improved seed at subsidized prices is ensured. In this regard Punjab Govt. subsidy package for Oilseed crops can be followed to increase gram area that further lead to increase its production.
- Gram is risky crop and grown on marginal areas and rainfed conditions so its yield is relatively low and variable as compare to other competing crops. Hence on the basis of results it is proposed to introduce some kind of insurance packages to farmers that motivate them to enhance the area under gram.
- Moreover, results of the model also recommend that either Govt may remove the support price for wheat the major competing crop or announce same support for gram to encourage farmers for enhancing the area under gram crop.
- To increase the gram production keeping area same needs the improvement in the production technology. For this purpose in the long run, high yielding, and climate and disease resistant varieties of gram need to be developed while in the short run the recently released improved varieties need to be multiplied on war footings and made easily accessible to the farmers.
Novelty Statement
This research shall help researchers and policy makers an indentifying the factors responsible for reduction in gram and production of crop in Punjab, Pakistan.
Author’s Contribution
Naheed Zahra: Conceived the idea of the research, collected the data and wrote the manuscript.
Muhammad Qasim: Anlysed the data and wrote the manuscript.
Muhammad Azam Niazi: Provided technical input, assistance and suggestions at each and every step of the research.
Muhammad Ishaq: Data collection, reviewed the literature and prepared first draft.
Mubbashira Nazir: Finalised the manuscript.
Conflict of interest
The authors have declared no conflict of interest.
References
Abou., A.T.A.E.M. and M.A.D.M.K.H. Begawy. 2008. Supply response for some crops in Egypt: A vector error correction approach. J. Appl. Sci. Res., 4(12): 1647-1657.
Ahmed, B., Z. Hussain and J. Longmire. 1993. Farm management handbook, economics and policy analysis project (chemonics international consulting division), agricultural services sector project (ASSP) and United States Agency for International Development (USAID), Islamabad.
Akkani, K.A. and T.A. Okeowo. 2011. Analysis of aggregate output supply response of selected food grains in Nigeria. J. Stored Prod. Postharvest Res., 2(14): 266-278.
Alemu, Z.G., K. Oosthuizen and H.V. Schalkwyk. 2003. Grain-supply response in Ethiopia: An error-correction approach. Agrekon, 42(4): 389-404. https://doi.org/10.1080/03031853.2003.9523631
Ali, A. and M.S. Rashid, 2009. An economic study of slow growth of crops in Pakistan: A case of pulses production in Punjab. Forman J. Econ. Stud., 5: 35-58.
Ali, M., and M. Abedullah. 1998. Supply, demand, and policy environment for pulses in Pakistan. Pak. Develop. Rev., pp. 35-52. https://doi.org/10.30541/v37i1pp.35-52
Ali, M., U. Farooq and Abedullah. 2005. Improving food security through pulses in south Asia. Paper presented in the symposium on nutrition security in south Asia, Organized by Nutrition Foundation India with the Support of Government of India and United States Department of Agriculture. March 7-9, 2005.
Anyaeji, E., 2017. The economic impact of fusion power in the UK’s 2050 energy mix. PhD. Dissertation submitted to the Department of Economics, University of Reading, UK.
Askari, H. and J.T. Cummings. 1977. Estimating agricultural supply response with the Nerlovemodel: A survey. Int. Econ. Rev., 18: 257-292. https://doi.org/10.2307/2525749
Baig, Z., 2018. Punjab government to promote gram cultivation Business Recorder, https://fp.brecorder.com/2018/01/20180110334334
Chaudhry, M.I., M.A. Tajammal and A. Hussain. 2002. Pulses varieties of Pakistan, federal seed certification and registration department, ministry of food, agriculture and livestock, Islamabad, Pakistan.
Darai, R., A. Sarker, L. Aryal, P. and Gaurand R.K. Neupane. 2021. Adoption and impact of pulses research and development strategies for Nepal. J. Hortic. Sci. For., 3(1): ISSN: 2768-1238.
Fahimifard, S.M. and M.S. Saboui. 2011. Supply response of cereals in Iran. An autoregressive distributive lag approach. J. Appl. Sci., 11(12): 2226-2231. https://doi.org/10.3923/jas.2011.2226.2231
FAO, 2016. Pulses are praised for their health, environmental and economic benefits. How can their full potential be tapped? Global forum on food security and nutrition. Discussion No. 128: 30.05.2016 – 19.06.2016. www.fao.org/fsnforum/activities/discussions/pulses.
FAO, 2018. State of food and agriculture in Asia and the pacific region, including future prospects and emerging issues. FAO regional conference for Asia and the pacific. Thirty-fourth session Nadi, Fiji, pp. 9–13.
FAO, 2020. Pakistan overview of food security and Nutrition. Towards a resilient food system. food and agriculture organization of the United Nations Pakistan
Ghafoor, A. and M. Nazam. 2016. Economic Analysis of policies affecting pulses in Pakistan: Report on a survey of pulse growers in the Thal region of Punjab, Pakistan. University of Agriculture, Faisalabad. Project funded by ACIAR.
GoP, 2019. Agricultural Statistics of Pakistan, 2018-19. Statistics Division, Pakistan Bureau of Statistics, Government of Pakistan, Islamabad.
GoP, 2019. Economic Survey of Pakistan, 2018-19. Finance Division, Economic Advisor’s Wing. Ministry of Finance. Government of Pakistan, Islamabad.
Grace, K., T.K. Immanuelra and M.B. Dastagiri. 2014. Supply response with mix of stationary and nonstationarydata: Case study in pulses, India. Economic affair, New Delhi Publisher. https://doi.org/10.5958/0976-4666.2014.00030.8
Hallam, D. and R. Zanoli, 1993. Error correction models and agricultural supply response. Eur. Review of Agricultural Economics, 2: 151-166 https://doi.org/10.1093/erae/20.2.151.
Jarque, C.M. and A.K. Bera. 1980. Efficient tests for normality, homoscedasticity and serial independence of regression residuals. Econ. Lett., 6(3): 255-259. https://doi.org/10.1016/0165-1765(80)90024-5
Khan, M.N., 2010. Production and acreage response of wheat in the North West Frontier Province (NWFP). Sarhad J. Agric., 26(3): 427-433.
Khan, R.A. and S.M.A. Hussain. 2007. Farm supply response to price: A case study of Sugarcane in Pakistan (1986–2005). J. Independent Stud. Res., 5(2): https://doi.org/10.31384/jisrmsse/2007.05.2.4
Kumar, S. and V.A. Bourai. 2012. Economics of pulses production, benefits and constraints. A specific study of villages of Uttarakhand, Indian). https://doi.org/10.9790/0837-0144153
Mohammad, S., M.S. Javed, B. Ahmad, and K. Mushtaq. 2007. Price and non-price factors affecting acreage response of wheat in different agro-ecological zones in Punjab: A co-integration analysis. Pak. J. Agric. Sci., 44(2): 370-377.
Mushtaq, K., and P.J. Dawson. 2002. Acreage response in Pakistan: A co-integration approach. Agric. Econ. 27: 111-121. https://doi.org/10.1111/j.1574-0862.2002.tb00110.x
Narayan, P.K., 2005. The saving and investment nexus for China: Evidence from cointegration tests. Appl. Econ., 37(17): 1979-1990. https://doi.org/10.1080/00036840500278103
Nerlove, M., 1958. Distributed lags and estimation of long run supply and demand elasticities: Theoretical considerations. J. Farm Econ., 40(2): 301-311. https://doi.org/10.2307/1234920
Nerlove, M. and K.L. Bachman. 1960. Analysis of the changes in agricultural supply, problems and approaches. J. Farm Econ., 3: 531-554. https://doi.org/10.2307/1235403
Pesaran, M.H., Y. Shin and R.J. Smith. 2001. Bounds testing approaches to the analysis of level relationships. J. Appl. Econ., 16: 289-326. https://doi.org/10.1002/jae.616
Riaz, B., S. Ali and D. Jan 2014. Acreage response analysis of maize growers in Khyber Pakhtunkhwa, Pakistan. Int. J. Food Agric. Econ., 2(3): 3344.
Savadatti, P., 2018. Supply response analysis of pulses in India. Int. J. Res. Cult. Soc., 2(1): 282-293.
Shahzad, M., A.U. Jan, S. Ali and R. Ullah. 2018. Supply response analysis of tobacco growers in Khyber Pakhtunkhwa: An ARDL approach. Field Crop Res., 218: 195-200. https://doi.org/10.1016/j.fcr.2018.01.004
Shrestha, M.B. and G.R. Bhatta. 2018. Selecting appropriate methodological framework for time series data analysis. J. Finance Data Sci., 4: 71-89. https://doi.org/10.1016/j.jfds.2017.11.001
Tuteja, U., 2006. Growth performance and acreage response of pulse crops: A state-level analysis. Ind. J. Agric. Econ., 61(2): 218-237.
To share on other social networks, click on any share button. What are these?

