Study of Biochemical Characters Gives an Insight into the Genetic Variation Present in F2 Populations of Ethiopian Mustard (Brassica carinata L.)


Research Article
Study of Biochemical Characters Gives an Insight into the Genetic Variation Present in F2 Populations of Ethiopian Mustard (Brassica carinata L.)
Muhammad Nauman1, Iftikhar Ali3, Nazir Ahmad1,2*, Fazli Ahad1 and Touheed Iqbal4
1Department of Plant Breeding and Genetics, The University of Agriculture, Peshawar, Khyber Pakhtunkhwa, Pakistan; 2Oil Crops Research Institute, The Graduate School of Chinese Academy of Agricultural Sciences, Beijing, P.R. China; 3Agriculture and Biotechnology Division, Pakistan Atomic Energy Commission, Islamabad-Pakistan; 4Directorate General Agriculture Research, Peshawar, Khyber Pakhtunkhwa, Pakistan.
Abstract | The selection of useful variation in crop plants has been a major thrust of early farmers since the dawn of agriculture. This study aimed to estimate genetic variability, heritability, and genetic advance for quality characters in Brassica carinata L. A total of 22 genotypes comprised of six parental lines and their 16 bulked F2 populations were evaluated in a randomized complete block design with three replications at The University of Agriculture Peshawar during 2013-14. Data were recorded on oil content, protein content, oleic acid, glucosinolates, erucic acid, and linolenic acid. Significant genetic differences were observed for all the traits studied. Among parental lines, C-88 performed better for protein content (20.48%) and erucic acid content (50.31%), C-89 for oleic acid (36.15%), and linolenic acid content (10.18%). Among F2 populations, C-95 × C-93, C-88 × C-95, C-97 × C-95, C-88 × C-89, C-93 × C-95 C-97 × C-88 performed better for oil content (51.48%), protein content (21.62%), oleic acid (37.60%), glucosinolates content (88.27 µMg-1), erucic acid (45.98%) and linolenic acid (11.74%), respectively. Moderate (30 < h2 ≤ 60) to high (h2 > 60) broad-sense heritability was observed for all biochemical traits with maximum genetic advance, hence indicated that selection could be effective in the early generation for the improvements of these studied traits. Generally, cross combinations C-88 × C-89, C-93 × C-95, C-97 × C-88 performed better for oleic acid, glucosinolate content, and erucic acid, so that these segregants could be used for biodiesel and other industrial purposes.
Received | May 02, 2021; Accepted | June 24, 2021; Published | November 08, 2021
*Correspondence | Nazir Ahmad, Department of Plant Breeding and Genetics, The University of Agriculture, Peshawar, Khyber Pakhtunkhwa, Pakistan; Email: nazir_aup@yahoo.com
Citation | Nauman, M., I. Ali, N. Ahmad, F. Ahad and T. Iqbal. 2021. Study of biochemical characters gives an insight into the genetic variation present in F2 populations of Ethiopian mustard (Brassica carinata L.). Journal of Innovative Sciences, 7(2): 275-280.
DOI | https://dx.doi.org/10.17582/journal.jis/2021/7.2.275.280
Keywords | Genetic variability, Genetic advance, Heritability, Oil content, Protein content
1. Introduction
Canola (Brassica carinata L., BBCC, 2n = 34) is the second most important oilseed worldwide, after soybean (FAO, 2016). Global food production has to double by 2050 to feed the growing human population (Ray et al., 2013). Brassica carinata belongs to the family Cruciferae (Williams, 1989). The family Cruciferae has about 338 genera and 3709 species (Warwick et al., 2006). It can be cultivated in low rainfed areas of the world. It keeps sufficient yield levels and resistance to different biotic and abiotic stresses (Getinet et al., 2003).
The high amount of erucic acid and glucosinolates contents give a bitter taste in brassica oil, making it unappealing for consumers to use edible oil. These chemical compounds result in oil a series of nutritional disorders and lower seed press cake palatability in farm livestock (Ahmad et al., 2020). Therefore, lowering the contents of these undesirable chemicals enhances the palatability of brassica oil. In recent decades, brassica oilseeds have been a source of edible oil and a source of biofuels and industrial feed. Such genera are regaining interest in cosmetics, emollients for lubricants, adhesive and biodegradable plastic products (McKeon et al., 2016).
Genetic variability is a measure of the tendency of genotypes in a population to differ from one another. The variability of a character describes a character’s tendency to vary in response to environmental and genetic influences. Such breeding exercises need to evaluate genetic variability, heritability, and genetic advance (Chaudhary et al., 1997). Heritability plays an important role in the breeding program of a crop. Higher heritability estimates make the selection procedures very simple (Khan et al., 2006) because their information facilitates evaluating genetic and environmental effects in selecting desirable traits. The higher the heritability of a character, the greater will be the expected genetic gain since artificial selection can be achieved more efficiently (Mazurkievicz et al., 2019). Estimation of heritability is also used to envisage genetic advance under selection. Genetic advance is the improvement of the genotypic mean values of selected plants over the base population. Traits with maximum heritability and genetic advance are thought to be under the control of additive gene action, highlighting the benefits of selection based on phenotypic performance (Aytaç and Kinaci, 2009). The present study’s goals were to determine genetic variability in F2 populations compared with their parental lines for biochemical traits of Brassica carinata, estimate heritability and genetic advance for biochemical characters in Brassica carinata, identify best segregants for industrial applications.
2. Materials and Methods
A field study was conducted at The University of Agriculture, Peshawar, during the crop season of 2013-14. Experimental material comprised 22 genotypes that included six parental lines and 16 F2 bulked populations (Table 1). The original crosses were made in 2011-12, and F1 hybrids were studied in 2012-13 (Nausheen et al., 2015). The experimental material was provided by the department of Plant Breeding and Genetics, The University of Agriculture, Peshawar. The experimental material was sown in a randomized complete block design with three replications. Ten plants from each parental line and F2 population per replication were randomly selected to record data. Data were recorded on biochemical traits.
Table 1: List of parental lines and their F2 populations of Brassica carinata L.
|
S. No |
Parental lines |
S. No |
F2 bulk populations |
|
1 |
C-88 |
8 |
C-90 x C-93 |
|
2 |
C-89 |
9 |
C-93 x C-90 |
|
3 |
C-90 |
10 |
C-93 x C-95 |
|
4 |
C-93 |
11 |
C-93 x C-97 |
|
5 |
C-95 |
12 |
C-95 x C-89 |
|
6 |
C-97 |
13 |
C-95 x C-93 |
|
S. No |
F2 bulk populations |
14 |
C-95 x C-97 |
|
1 |
C-88 x C-89 |
15 |
C-97 x C-88 |
|
2 |
C-88 x C-90 |
16 |
C-97 x C-95 |
|
3 |
C-88 x C-93 |
||
|
4 |
C-88 x C-95 |
||
|
5 |
C-88 x C-97 |
||
|
6 |
C-89 x C-88 |
||
|
7 |
C-89 x C-93 |
2.1 Statistical data analysis
2.1.1 Analysis of variance
The data was managed to scrutinize the variance technique proposed for randomized complete block design, as suggested by (Steel and Torrie, 1960). Significant differences among all genotypes were further computed through the least significant difference (LSD) test using 5% probability level.
2.1.2 Heritability estimates
Heritability assessments can also be used to guess genetic advance under selection so that the plant breeder can predict progress from different types. The broad-sense heritability was calculated by the following formulae suggested by (Singh and Chaudhary, 1977):
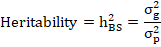
Where, h2BS = Broad sense-heritability, σ2g = genotypic variance and σ2p= phenotypic variance.
Heritability values were also categorized as low, moderate, and high according to (Robinson et al., 1951). Low= h2 ≤ 30, Moderate= 30 < h2 ≤ 60, High= h2 > 60
2.1.3 Genetic advance (GA)
Genetic advance was computed by the following formula suggested by (Panse and Sukhatme, 1954).

Where, k= 1.76 for 10% selection intensity, h2= Heritability coefficient, σp= Phenotypic standard deviation.
3. Results and Discussion
3.1 Oil content (%)
High oil content is the plant breeder’s substantial goal because it ensures the seed quality in oilseed crops. Statistical analysis for oil contents in Brassica seeds revealed significant differences among genotypes, parental lines, and F2 population, while parents vs. F2 exhibited non-significant differences (Table 2). Previous researchers (Ahmad et al., 2020) (Kumar, 2013) also reported significant variations in oil contents. Means for Oil contents in parental lines ranged from 46.10% (C-88) to 50.79% (C-95). Among F2 populations, minimum (43.34%) oil contents were recorded for cross combination C-95×C-89, while maximum (51.48%) for cross combination C-95×C-93 (Figure 1). Mean performance of parental lines and their F2 populations revealed that plants had approximately the same oil contents. Genetic variance (1.40) was slightly less than environmental variance (2.30) for oil contents that resulted in moderate heritability (37.74%) and genetic advance of 1.28% at 10% selection intensity (Table 3). It concluded that this character’s environmental conditions moderately influenced gene expression and selection should be made carefully. Kumar (2013) also recorded moderate heritability among parental lines and their F1 hybrids.
3.2 Protein content (%)
Protein provides building blocks for an organism’s growth and development, and it is an important requirement for all living organisms. Protein contents were significantly different among genotypes, parental lines, F2 progenies, and the contrast between parental lines and their F2 progenies (Table 2). Means of parental lines ranged from 18.12% (C-93) to 20.48% (C-88). Means for F2 populations ranged from 18.99% (C-93 × C-97) to 21.62 % (C-88 × C-95) (Figure 1). Brassica genotypes’ mean performance showed that plants from F2 populations had comparatively more protein contents than their parental lines. For protein contents, genetic and environmental variances were 0.74 and 0.63, respectively, which resulted in moderate heritability (54.03%), and a genetic advance of 1.11% at 10% selection intensity was observed (Table 3). It showed that this character’s gene expression was under partial environmental effects, and selection should be made with care. Our moderate heritability results are contrary to the previous findings of (Alemayehu and Becker, 2006), who reported high heritability in inbred lines of Brassica carinata for protein contents. Earlier researchers (Kumar, 2013; Shaukat, 2014) also recorded moderate heritability for protein content.
Table 2: Mean squares for different biochemical traits.
|
SOV |
Reps (df = 02) |
Genotypes (df = 21) |
Parents (df = 05) |
F2s (df = 15) |
Parents vs. F2s (df = 01) |
Error (df =42) |
C.V (%) |
|
Oil content |
0.26 |
6.49** |
12.12** |
4.82* |
3.33NS |
2.30 |
3.08 |
|
Protein content |
0.24 |
2.84** |
2.69** |
1.54** |
23.13** |
0.63 |
3.92 |
|
Oleic acid |
2.11 |
16.61** |
14.69** |
16.50** |
28.01** |
2.55 |
4.78 |
|
Glucosinolate content |
8.25 |
225.55** |
349.24** |
197.20** |
32.31NS |
51.10 |
6.98 |
|
Erucic acid |
2.37 |
40.54** |
41.66** |
42.62** |
3.62NS |
5.91 |
4.40 |
|
Linolenic acid |
0.38 |
2.14** |
3.76** |
1.49** |
3.74** |
0.53 |
5.76 |
*, **: significant at 1% and 5% level of probability.
3.3 Oleic acid (%)
Oleic acid is composed of unsaturated fatty acids suitable for human health because it reduces blood cholesterol levels and enhances the oil’s shelf life. Significant differences among genotypes, parental lines, F2 populations, and interaction between parental lines and their F2 populations for oleic acid were recorded (Table 2). In advance lines of Brassica napus, (Ahmad et al., 2013) also reported significant variations for oleic acid. Among parental lines, the least oleic acid contents (30.06%) were found in C-95 and more (36.15 %) in C-89. Among F2 populations, least oleic acid contents (28.97%) were found in C-93 × C-95 and more (37.60%) in C-97 × C-95 (Figure 1). The contrast of mean performance between parental lines and their F2 populations revealed that plants from F2 populations had more oleic acid contents than their parental lines. Genetic variance (4.69) was two times more than the environmental variance (2.55), which resulted in high heritability (64.79%) and genetic advance of 3.07% at 10% selection intensity for oleic acid (Table 3). It revealed that the character was genetically controlled, and selection in early generations can be possible. High heritability for oleic acid was also recorded in Brassica genotypes and their F2 progenies (Iqbal et al., 2014).
Table 3: Environmental variance (Ve), genotypic variance (Vg), phenotypic variance (VP), broad-sense heritability (h2BS), and genetic advance (G.A) for biochemical traits.
|
Traits |
Ve |
Vg |
Vp |
h2BS (%) |
G.A |
|
Oil content (%) |
2.30 |
1.40 |
3.70 |
37.74 |
1.28 |
|
Protein content (%) |
0.63 |
0.74 |
1.36 |
54.03 |
1.11 |
|
Oleic acid (%) |
2.55 |
4.69 |
7.24 |
64.79 |
3.07 |
|
Glucosinolates content (μMg-1) |
51.10 |
58.15 |
109.25 |
53.23 |
9.79 |
|
Erucic acid (%) |
5.91 |
11.54 |
17.45 |
66.12 |
4.86 |
|
Linolenic acid (%) |
0.53 |
0.54 |
1.06 |
50.46 |
0.92 |
3.4 Glucosinolates (µMg-1)
Glucosinolates are the unfavorable component of oilseed crops for edible purposes, posing health risks in seed meals to livestock and different health problems in human beings. Besides harmful effects, glucosinolates had a useful role in plant defense against insect pests and fungal diseases. Considerable differences were recorded in genotypes for glucosinolates contents. Variations among parental lines and their F2 progenies were significant, while the interaction between parental lines and their F2 progenies demonstrated non-significant differences among themselves (Table 2). Minimum (89.43 µMg-1) glucosinolates contents in parental lines were recorded for C-89 and maximum (119.44 µMg-1) for C-97. Minimum (88.27 µMg-1) glucosinolates contents in F2 populations were recorded for cross combination C-88 × C-89 and maximum (117.36 µMg-1) for C-88 × C-95 (Figure 2). It concluded that means of parental lines and their F2 populations had the same amount of glucosinolates contents. According to Table 3, genetic and environmental variances for glucosinolates were 58.15 and 51.10, respectively, which resulted in moderate heritability (53.23%) and genetic advance of 9.79 µMg-1 at 10% selection intensity. It illustrated that environmental conditions slightly affected gene expression and selection should be practiced with more responsibility for this character. Our findings are also evidenced by the previous results (Abraha et al., 2008), who recorded moderate heritability for glucosinolates contents in double haploid lines of Brassica carinata.
3.5 Erucic acid (%)
For the edible purpose, one of the most unwanted constituents of the oilseed crops is its high level of erucic acid because it increases blood cholesterol levels. For industrial purposes, a high level of erucic acid can be used as a precursor to biodiesel fuel. Analysis of variance revealed considerable variations among genotypes, parental lines, and F2 populations, while interaction between parental lines and their F2 populations were non-significant (Table 2). Means for parental lines ranged from 50.03% (C-88) to 59.38% (C-95). Means for F2 populations ranged from 45.98% (C-93 × C-95) to 58.25% (C-95 × C-97) (Figure 2). Comparison of means performance between parental lines and their F2 populations showed that plants from parental lines and their F2 populations had almost the same erucic acid contents. For erucic acid, genetic and environmental variances were 11.54 and 5.91, respectively. Thus, the genetic variance was double that of environmental variance, resulting in high heritability (66.12%) and a genetic advance of 4.86% at 10% selection intensity (Table 3). It revealed that the predominant role of additive gene action hence, selection in early generations, could be possible for this character. Our results were in agreement with (Ahmad et al., 2020).
3.6 Linolenic acid (%)
Low linolenic acid contents are also desirable in oil like low glucosinolates and erucic acid contents (for edible purpose) because its higher level disturbs the stability of oil during storage and frying. Analysis of linolenic acid validated significant differences among genotypes, parental lines, F2 populations, and interaction between parental lines and their F2 populations (Table 2). Our results for significant variations correspond with the previous outcomes (Abideen et al., 2013), who confirmed considerable variations among Brassica napus genotypes for linolenic acid. The minimum (10.81%) and the maximum (13.98%) were recorded in parental lines C-89 and C-97 among Brassica genotypes for linolenic acid contents, respectively. Among F2 populations, the minimum (11.74%) linolenic acid contents were found in C-97 × C-88 and the maximum (13.84%) in C-90 × C-93 (Figure 2). It proposed that F2 populations contain more linolenic acid than their parental lines. For linolenic acid, genetic and environmental variances were 0.54 and 0.53, respectively, resulting in moderate heritability (50.46%) and genetic advance of 0.92% at 10% selection intensity (Table 3). It suggested that environmental conditions had little effect on gene expression, and selection should be practiced with more care for this character. Our results are in line with (Khan et al., 2020).
Conclusions and Recommendations
All the studied characters were significantly different among Brassica genotypes. Maximum oil, protein, and oleic acid contents were recorded for genotypes C-97, C-88 × C-95, and C-97 × C-95, respectively. Higher heritability coupled with maximum genetic advance was estimated for erucic acid and oleic acid. Simultaneously, a high level of glucosinolates and erucic acid contents were recorded for the F2 population C-95 × C-97 so that these segregants could be used a feedstock for biodiesel and other industrial applications.
Novelty Statement
A significant amount of genetic variability was observed among the studied genotypes for different biochemical traits. Hence, the present study can provide insights into rapeseed for the biofuel industry and other health-related issues.
Author’s Contribution
Muhammad Nauman: Conducted the experiment and wrote the initial draft.
Iftikhar Ali: Helped in assessing biochemical traits at NIFA laboratory.
Nazir Ahmad: Arranged, revised and designed the manuscript.
Fazli Ahad: Helped in the field data collection.
Touheed Iqbal: Provide help in statistical data analysis.
Conflict of interest
The authors have declared no conflict of interest.
References
Abideen, S.N.U., Nadeem, F., and Abideen, S.A., 2013. Genetic variability and correlation studies in Brassica napus L. genotypes. International Journal of Innovation and Applied Studies, 2(4): 574–581.
Abraha, E., Klima, M., Vyvadilovam., and Bechyne, M. 2008. Assessment of some agronomic and seed quality traits in Brassica carinata landrace genotypes doubled haploid lines and hybrids. Agricultura tropica et subtropica.
Ahmad, B., Muhammad, S., Ali, J., and Ali, I., 2013. Genetic variability studies of some quantitative traits in advancemutant lines of winter rapeseed. Life Science Journal, http://www.lifesciencesite.com. 10: 103–108.
Ahmad, N., Raziuddin, R., Ahad, F., Iqbal, T., Khan, N., Nauman, M., and Hameed, F., 2020. Genetic analysis of biochemical traits in F3 populations of rapeseed (Brassica napus L.). Asian Journal of Agriculture and Biology, 8(4): 491–500. https://doi.org/10.17582/journal.pjar/2020/33.2.253.263
Alemayehu, N., and Becker, H., 2006. Quantitative genetic analysis of total glucosinolate, oil and protein contents in Ethiopian mustard (Brassica carinata A. Braun). SINET: Ethiopian Journal of Science, 28(2): 141–150. https://doi.org/10.4314/sinet.v28i2.18250
Aytaç, Z., and Kinaci, G., 2009. Genetic variability and association studies of some quantitative characters in winter rapeseed (Brassica napus L.). African Journal of Biotechnology, 8(15): 3547–3554.
Chaudhary, S.P.S., Sharma, S.N., and Singh, A.K., 1997. Line x tester analysis in Indian mustard [Brassica juncea (l.) czern and coss.]. The Indian Journal of Genetics and Plant Breeding (India).
FAO, 2016. Food and Agriculture Organization of the United Nations.
Getinet, A., Rakow, G., and Downey, R.K., 2003. Agronomic performance and seed quality of Ethiopian mustard in Saskatchewanl.
Iqbal, S., Farhatullah, Nasim, A., Kanwal, M., and Fayyaz, L., 2014. Heritability studies for seed quality traits in introgressed segregating populations of Brassica. Pakistan Journal of Botany, 46(1): 239-243.
Khan, F.A., Ali, S., Shakeel, A., Saeed, A., and Abbas, G., 2006. Genetic variability and genetic advance analysis for some morphological traits in (Brassica napus L.). J. Agric. Res., 44(2): 83–88.
Khan, N., Raziuddin, Ahmad, N., and Ahad, F., 2020. Genetic variability and regression analysis for yield and quality traits in Brassica napus. Research in Plant Biology, 10: 8–14. https://doi.org/10.25081/ripb.2020.v10.6287
Kumar, S., 2013. Genetic analysis of oil content and quality parameters in Indian mustard (Brassica juncea (L.) Czern and Coss). Scholarly Journal of Agricultural Science, 3: 299–304.
Mazurkievicz, G., Ubert, I. de P., Krause, F.A., and Nava, I.C., 2019. Phenotypic variation and heritability of heading date in hexaploid oat. Crop Breeding and Applied Biotechnology, 19(4): 436–443. https://doi.org/10.1590/1984-70332019v19n4a61
McKeon, T., Hayes, D.G., Hildebrand, D., and Weselake, R., 2016. Industrial oil crops. Elsevier. https://doi.org/10.1016/B978-1-893997-98-1.00011-7
Nausheen, Farhatullah, Khalil, I.H., and Amanullah. 2015. Heterosis and heterobeltiotic studies of F1 hybrids in Brassica carinata. Pakistan Journal of Botany, 47(5): 1831–1837.
Panse, V.G., and Sukhatme, P.V., 1954. Statistical methods for agricultural workers. In Statistical methods for agricultural workers. Indian Council of Agricultural Research, New Delhi.
Ray, D.K., Mueller, N.D., West, P.C., and Foley, J.A., 2013. Yield trends are insufficient to double global crop production by 2050. PLoS One, 8(6). https://doi.org/10.1371/journal.pone.0066428
Robinson, H.F., Comstock, R.E., and Harvey, P.H., 1951. Genotypic and phenotypic correlations in corn and their implications in selection 1. Agronomy Journal, 43(6): 282–287. https://doi.org/10.2134/agronj1951.00021962004300060007x
Shaukat, S., 2014. Genetic variation and heritability estimates of quality traits in Brassica napus L. Journal of Biology, Agriculture and Healthcare, 4(20): 1–4.
Singh, R.K., and Chaudhary, B.D., 1977. Biometrical methods in quantitative genetic analysis. Biometrical methods in quantitative genetic analysis Kalyani.
Steel, R.G.D., and Torrie, J.H., 1960. Principles and procedures of statistics. McGraw-Hill Book Company, Inc., New York, Toronto, London. Principles and procedures of statistics.
Warwick, S.I., Francis, A., and Al-Shehbaz, I.A., 2006. Brassicaceae: Species checklist and database on CD-Rom. Plant Systematics and Evolution, 259(2–4): 249–258. https://doi.org/10.1007/s00606-006-0422-0
Williams, P.H., 1989. Rapid-Cycling Brassicas (RCB’s) in hands-on teaching of plant biology. Tested Studies for Laboratory Teaching. Proceedings of the Tenth Workshop/Conference of the Association for Biology Laboratory Education (ABLE), pp. 1–30.
To share on other social networks, click on any share button. What are these?